Telemetry and the track map
Every lap you drove and every input you made, beside a satellite map of the track with your braking painted on it. Pick a corner and the map and the traces zoom to it, with your engineer's advice for that corner beside them.
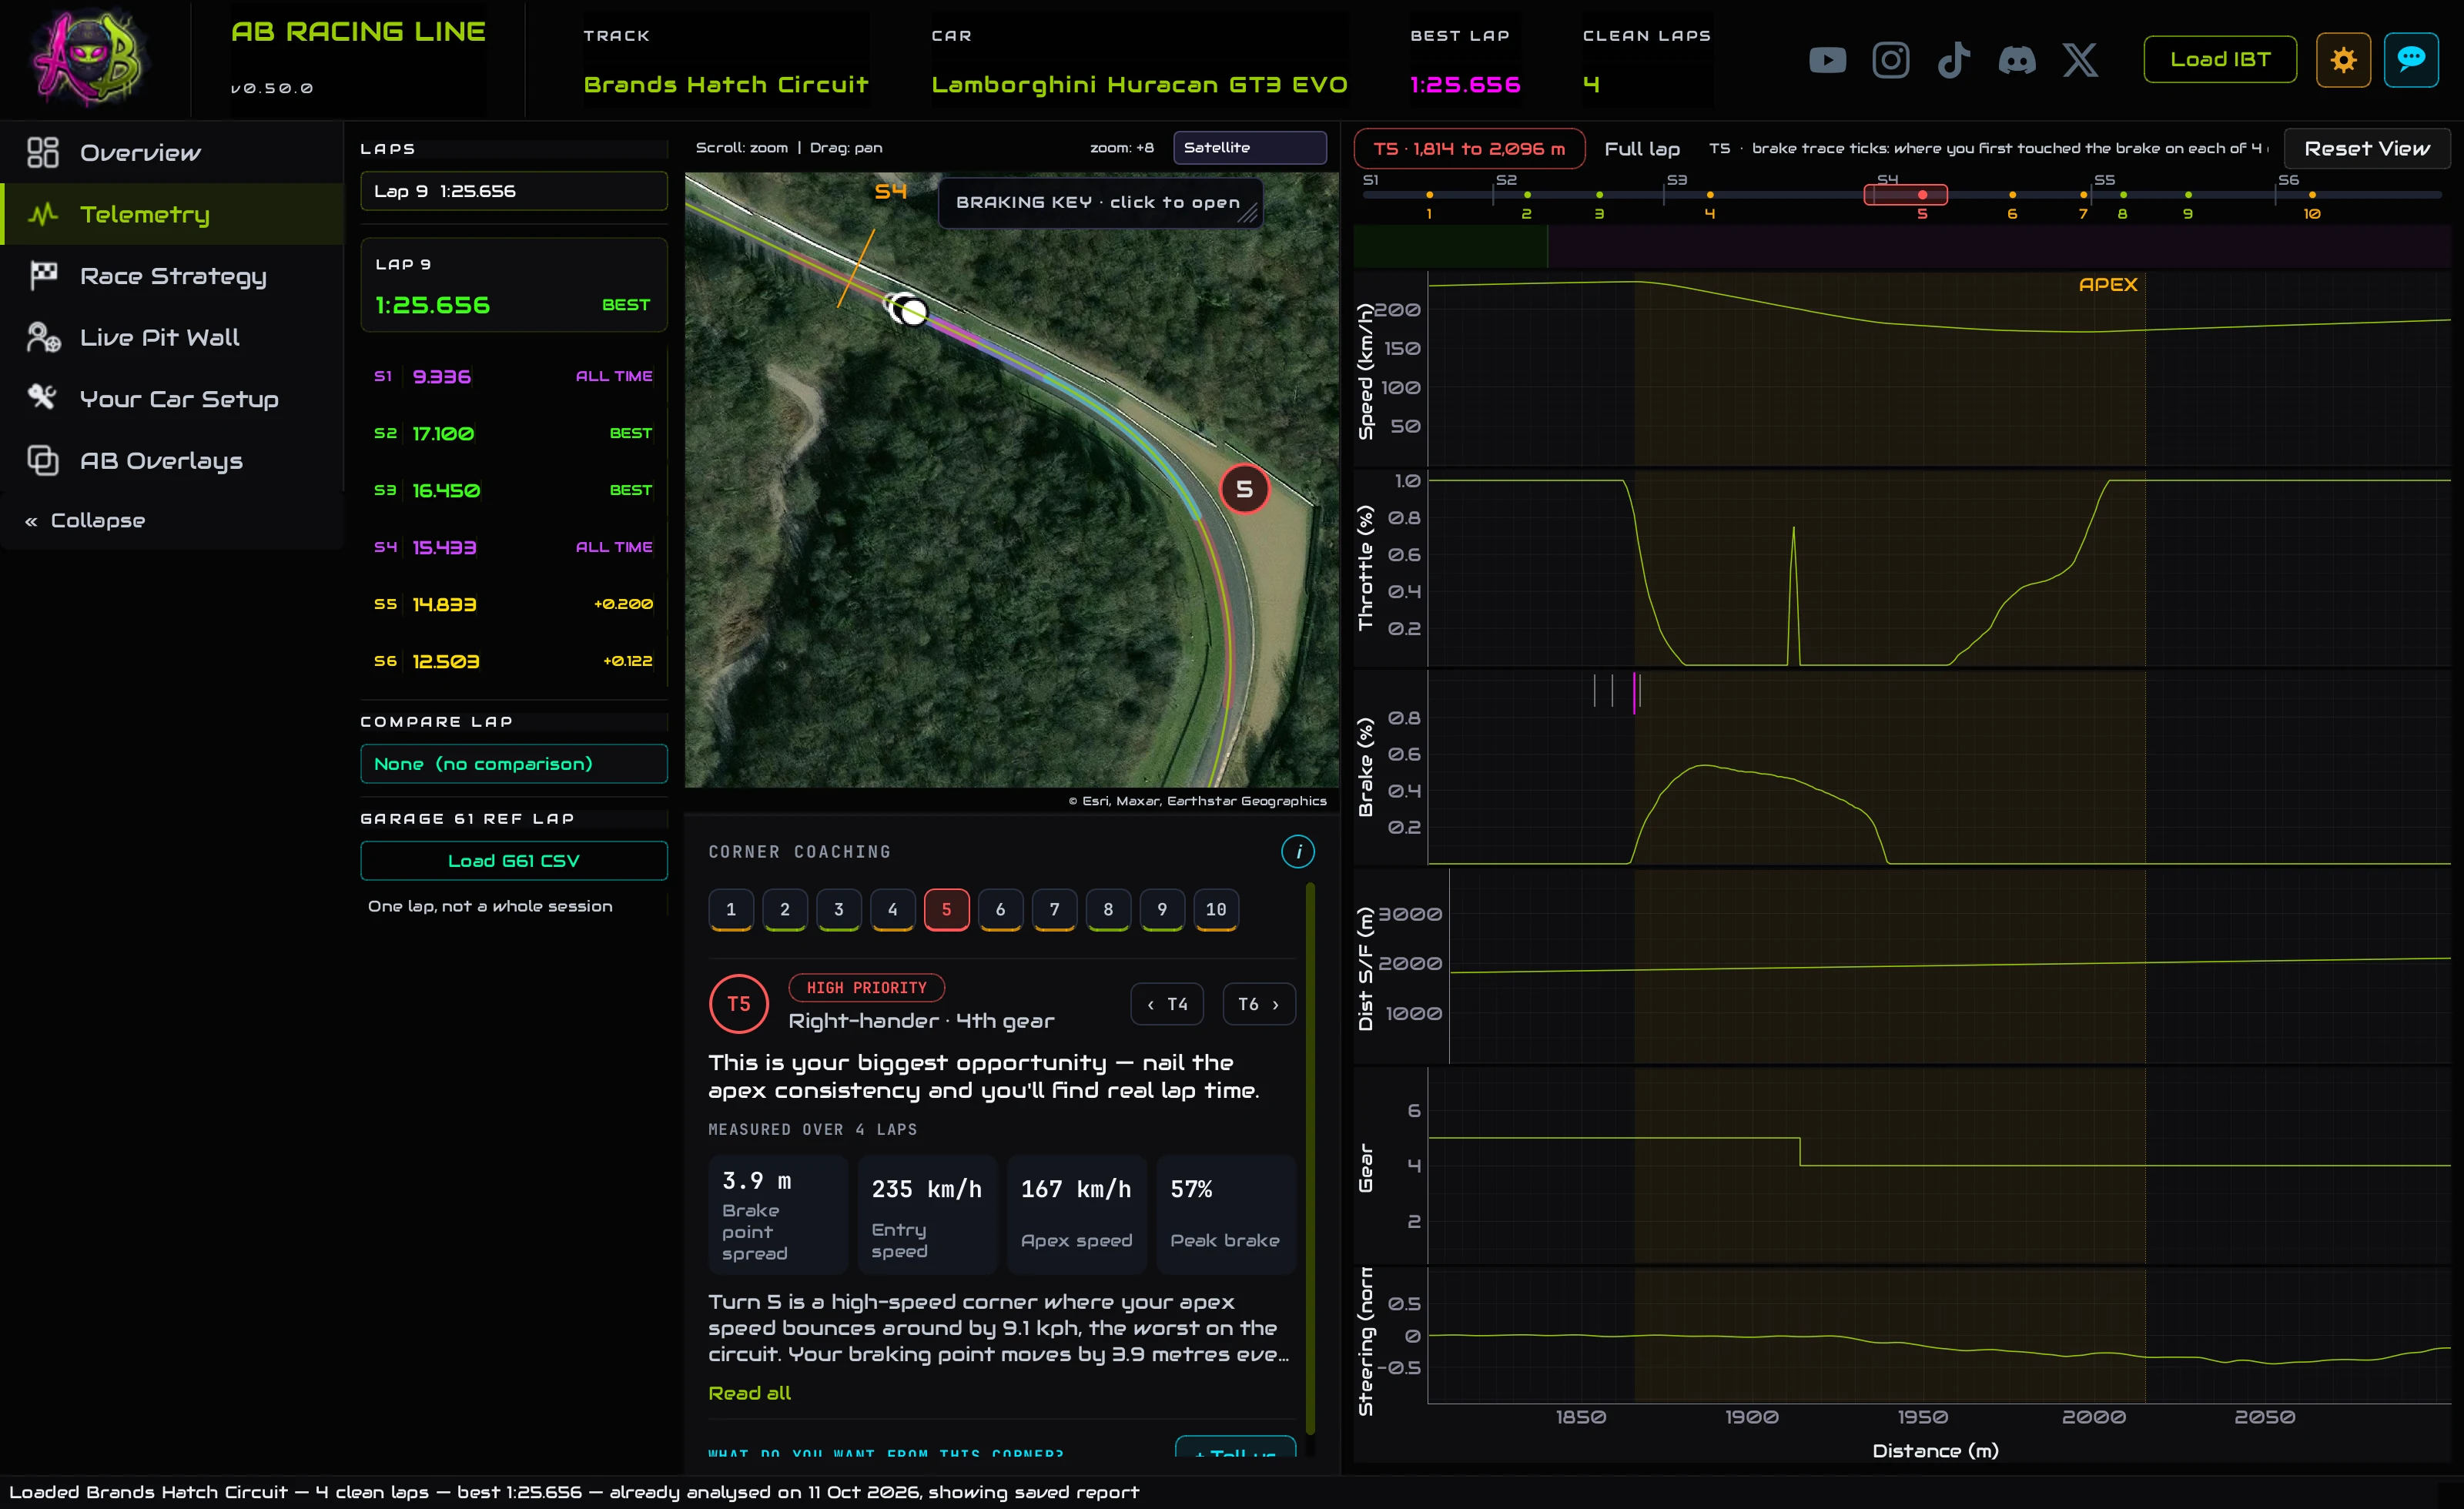
- Your best lap is on screen when the tab opens. Pick another in Laps on the left.
- Click a corner's number on the map: the map and the traces zoom to it, with its coaching under the map.
- Pick a Compare lap to see where the time went between two laps.
- Reset View, or Full lap, zooms back out.
OverviewThe tab at a glance
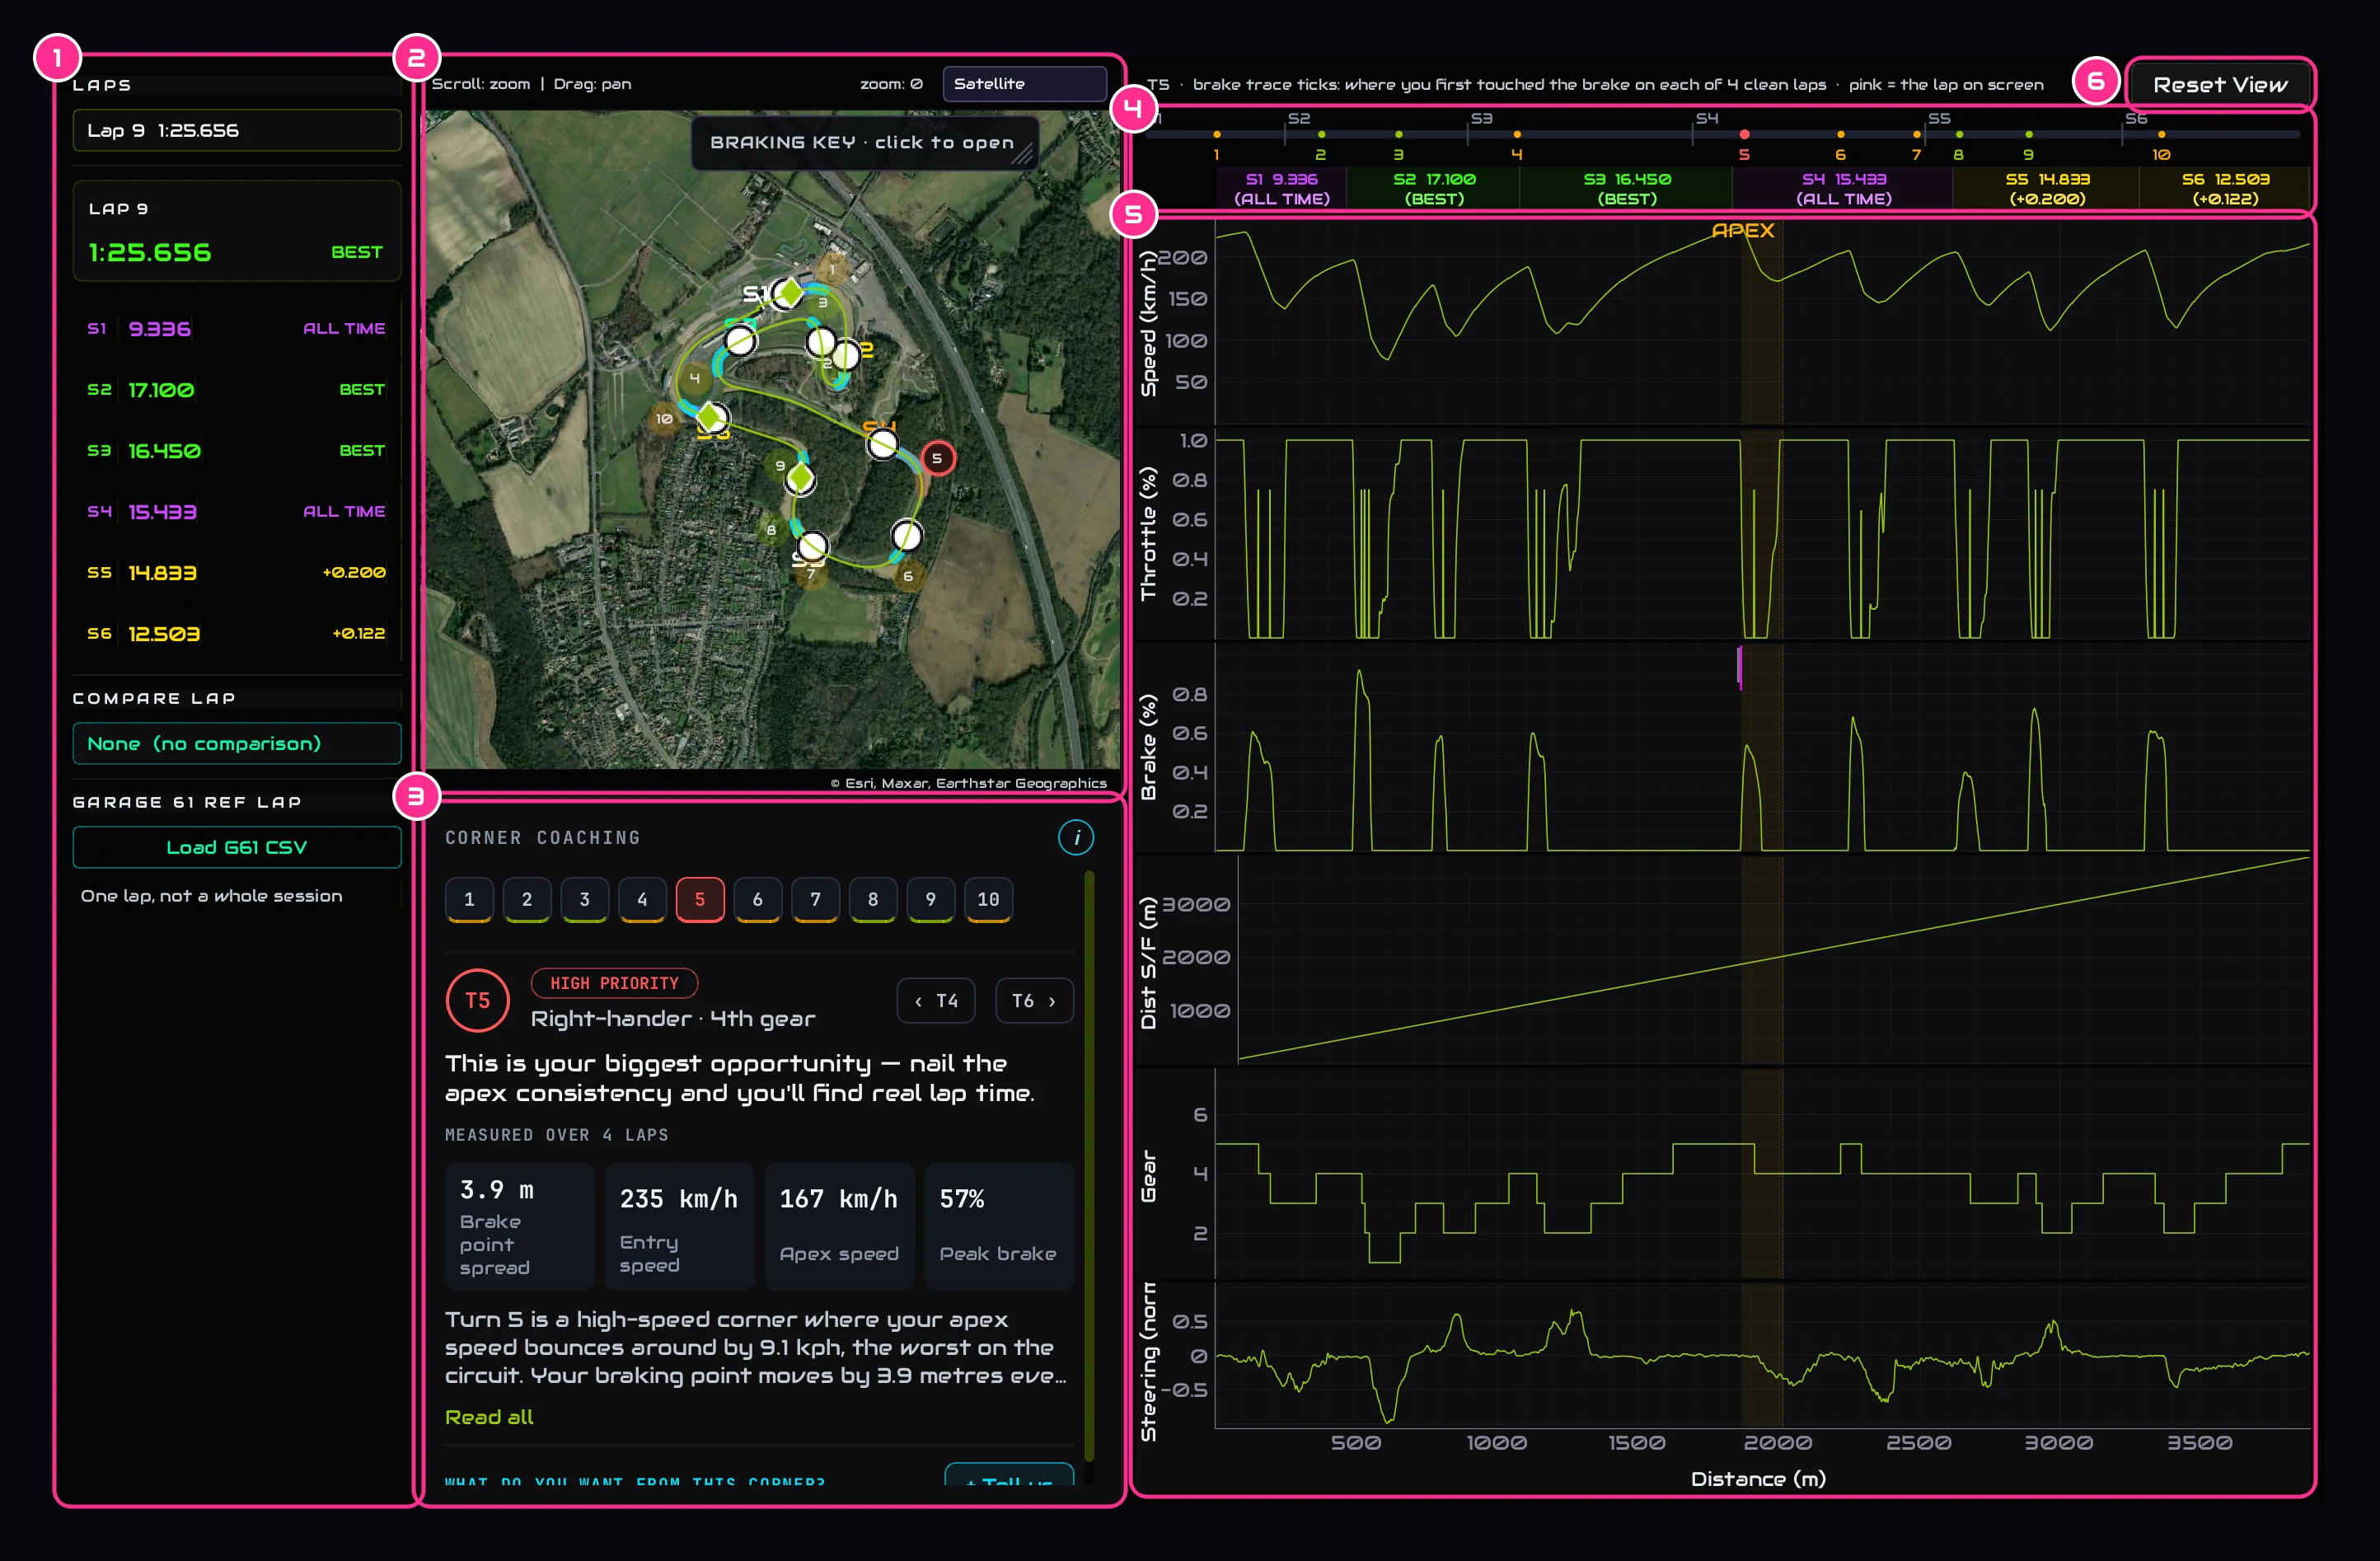
- 1LapsThe lap on screen, its sectors, a lap to compare with, and a Garage 61 lap.
- 2Track mapThe track from above, your braking painted on it.
- 3Corner coachingThe corner you picked: your engineer's advice and what we measured.
- 4The whole lapEvery corner along the lap, and each sector's time.
- 5The tracesSpeed, throttle, brake, distance, gear and steering, through the lap.
- 6Reset ViewBack to the whole lap, on the traces and the map.
LapsLaps and sectors
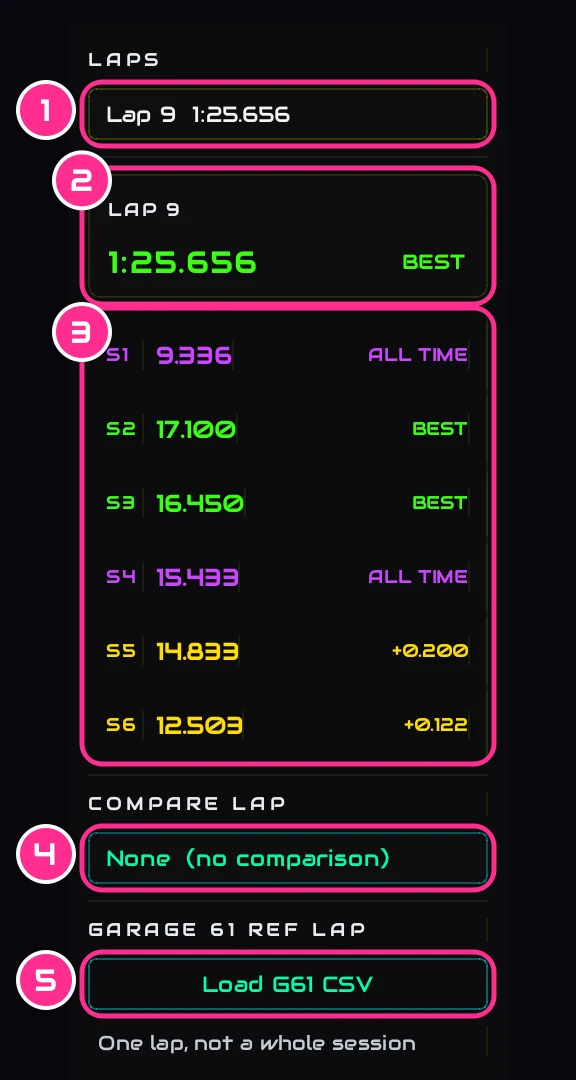
- 1The lapPick any clean lap. Your best is picked for you.
- 2Its timeWith BEST on your best lap, or the gap to it.
- 3Its sectorsEach sector's time, coloured like a timing screen.
- 4Compare lapA second lap to lay over this one (see Compare two laps).
- 5Load G61 CSVA lap from Garage 61 to compare with (see A Garage 61 lap).
The sector colours:
- ALL TIMEYour best ever in that sector at this car and track.
- BESTYour best in that sector this session.
- +0.200Slower than your best this session, by that much.
From aboveThe track map
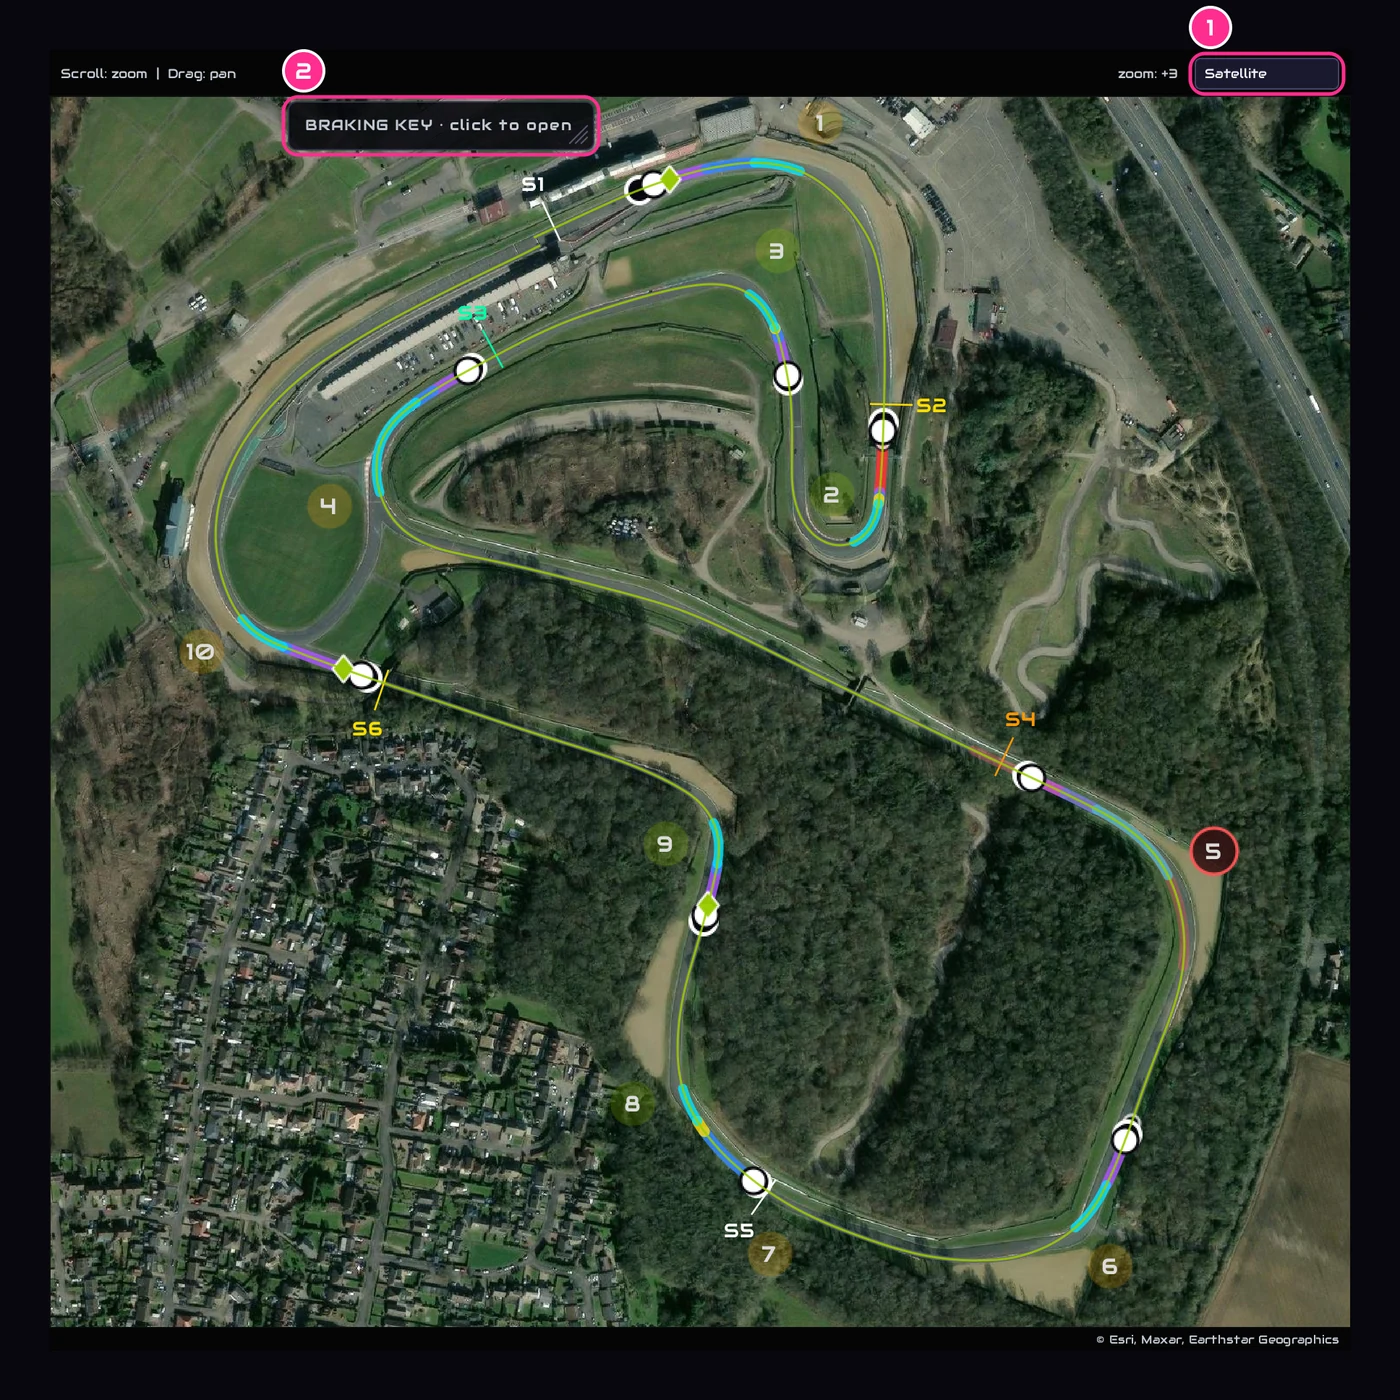
- 1Map styleSatellite, Dark, Street or Terrain.
- 2Braking keyClick it to open what the colours and marks mean. Drag it to move it, and its corner to size it.
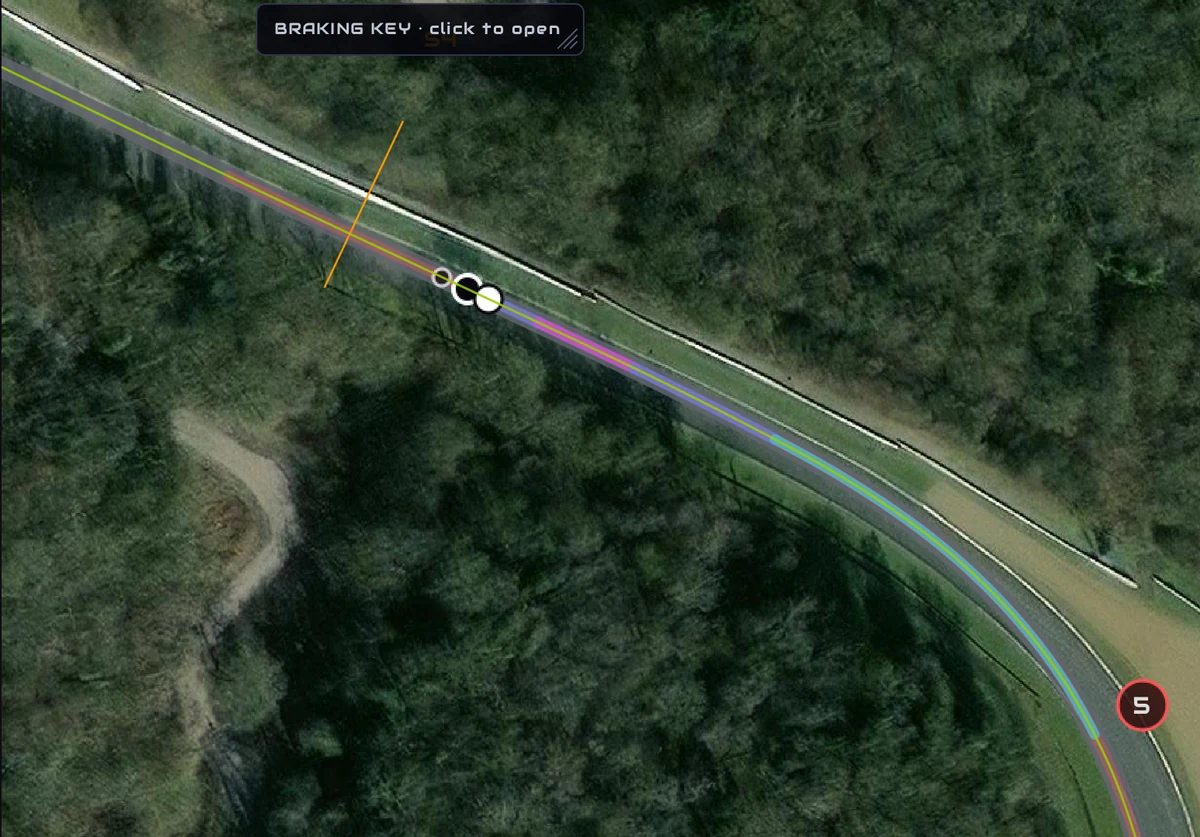
- The line is your lap. Where you braked it turns the colour of how hard you pressed.
- The numbers are the corners, coloured by your engineer's priority: red and amber are worth working on, green is polish. Click one to pick that corner.
- S1, S2… mark where each sector starts.
- Scroll to zoom, drag to move. When you hover over the traces, a dot shows where you are on the map.
Reading your braking
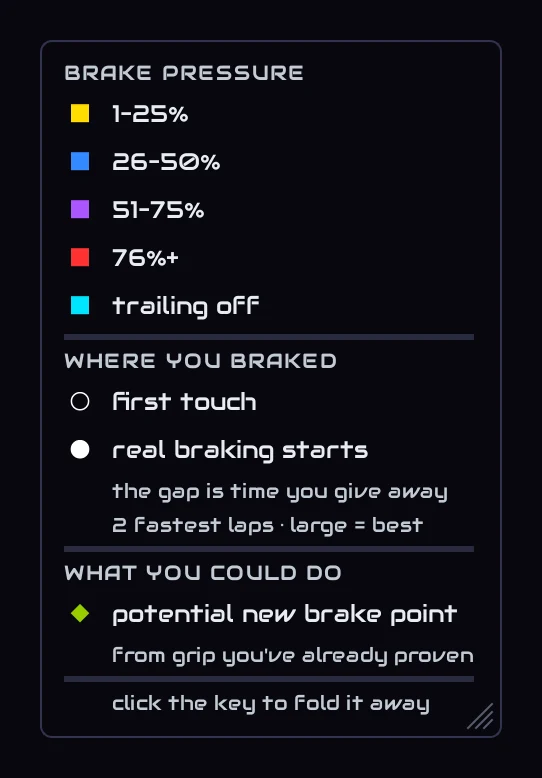
- Brake pressure: yellow up to 25%, blue to 50%, purple to 75%, red above that, and cyan where you were trailing off the brake into the corner.
- Hollow circle: where your foot first touched the brake. Filled circle: where real braking started. The gap between them is time you give away. They're shown for your two fastest laps; the larger pair is your best.
- Green diamond: a later brake point, worked out from grip you've already shown in this session. It only appears where your own laps prove there's room.
The map's background needs an internet connection. Without one, the track still draws as a line with everything on it.
Every inputThe traces
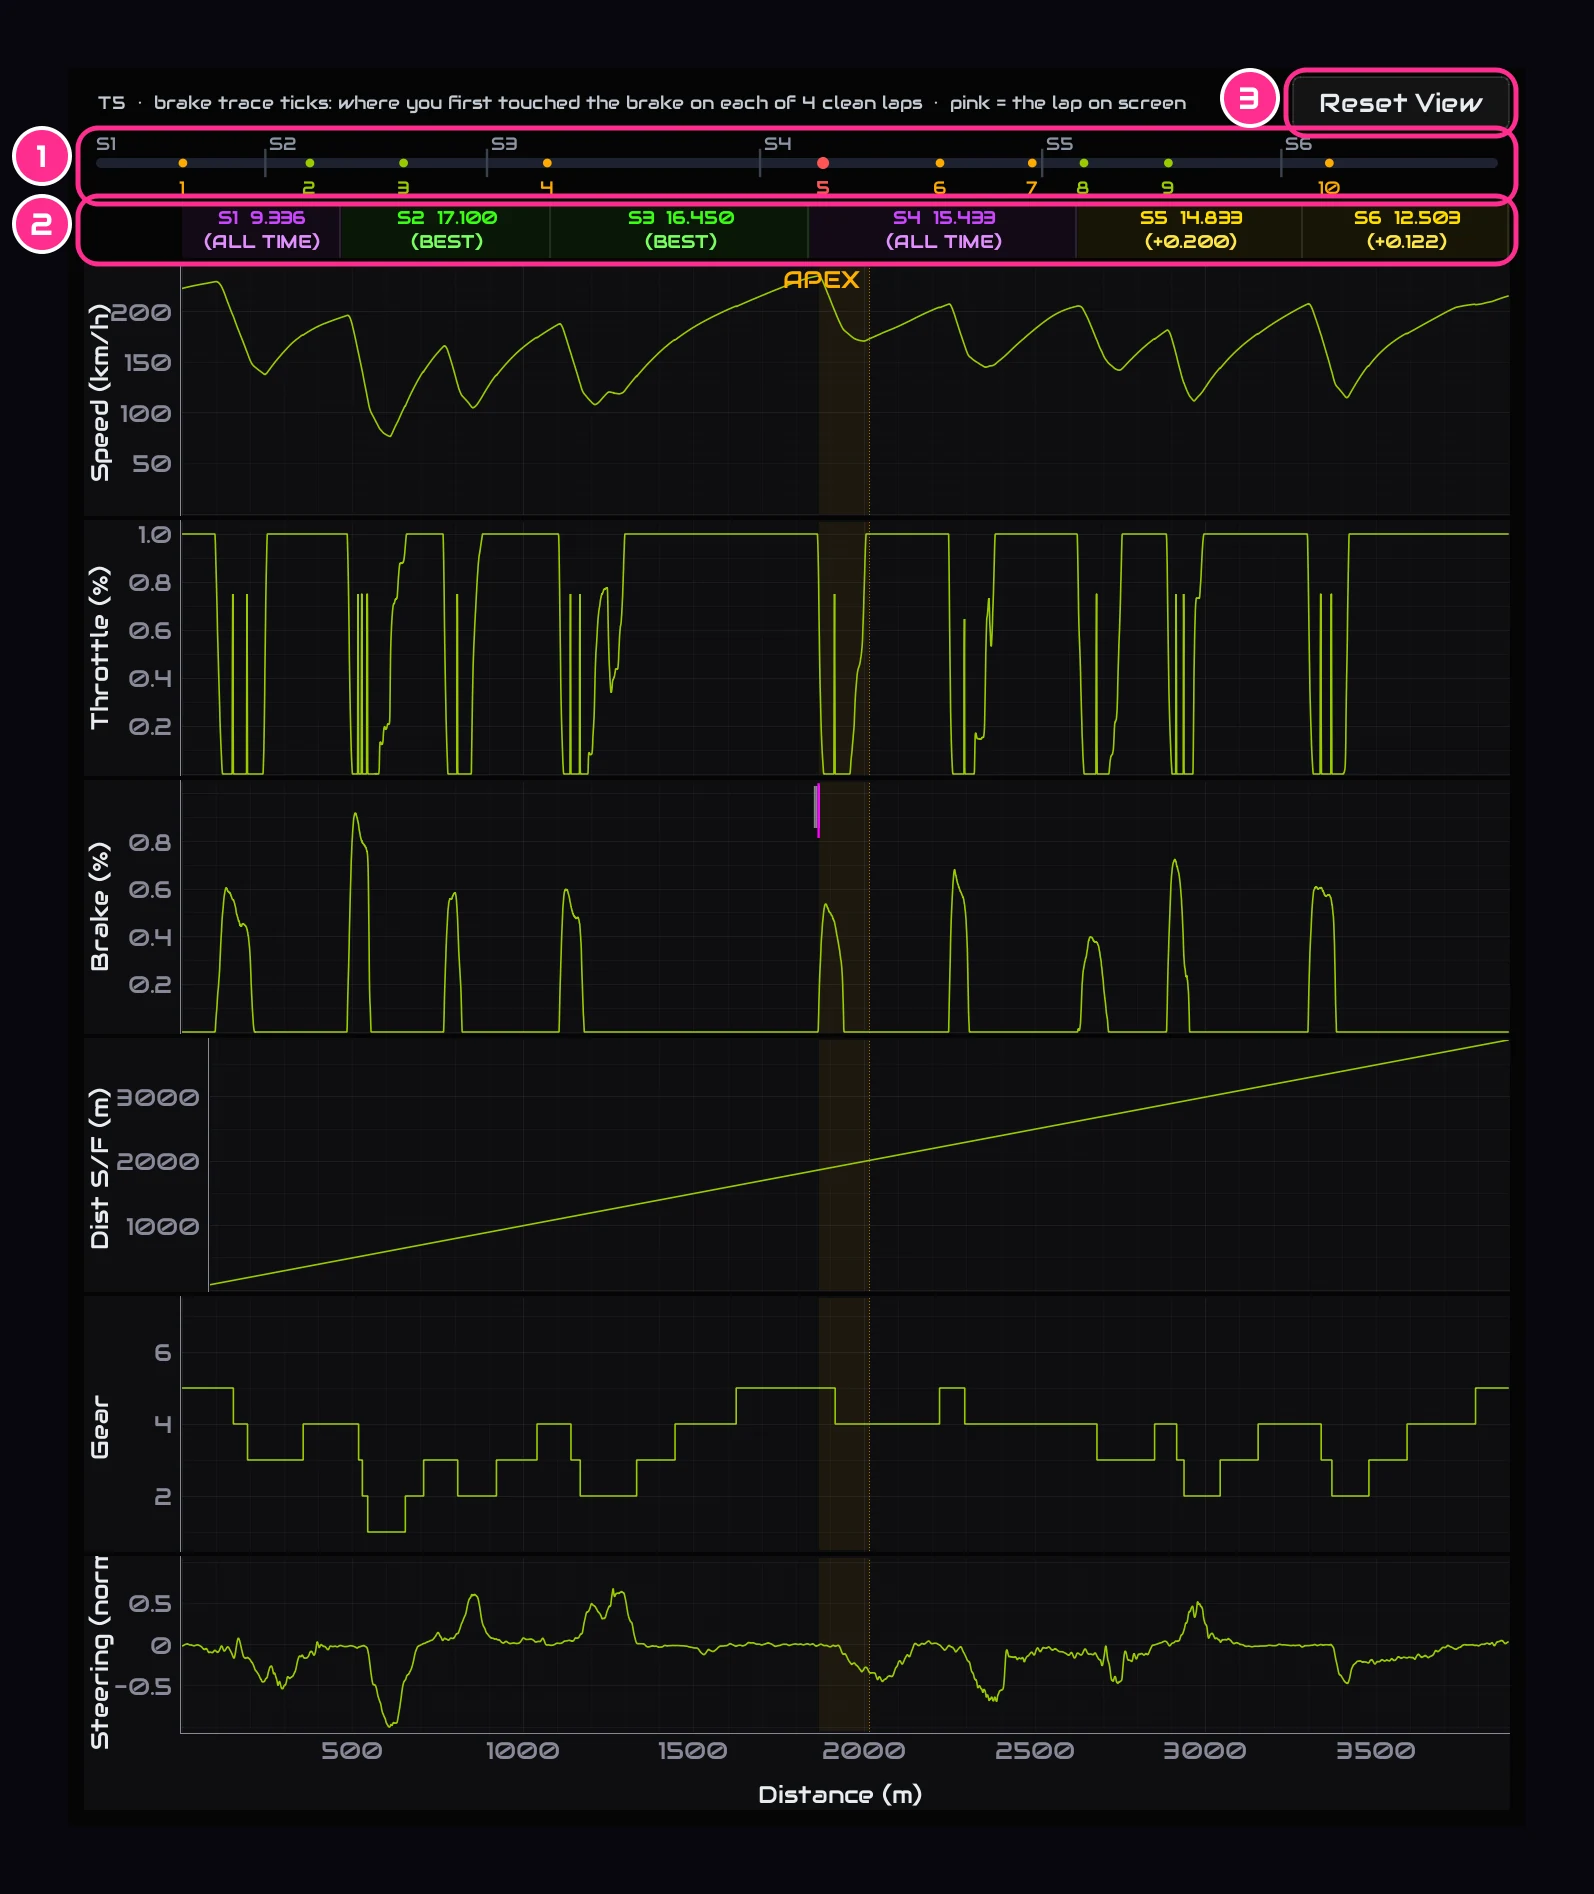
- 1The whole lapEvery corner along the lap, in its coaching colour. Click one to pick it.
- 2The sectorsEach sector's time. Click one to zoom to it.
- 3Reset ViewBack to the whole lap.
The traces are speed, throttle, brake, distance from the start line, gear and steering, all on one distance scale. Hover to read every trace at that point. Drag to zoom into a stretch, right-drag to move along it, scroll to zoom. The map follows the zoom. Speeds and distances are in the units you picked in Settings.
One cornerPick a corner
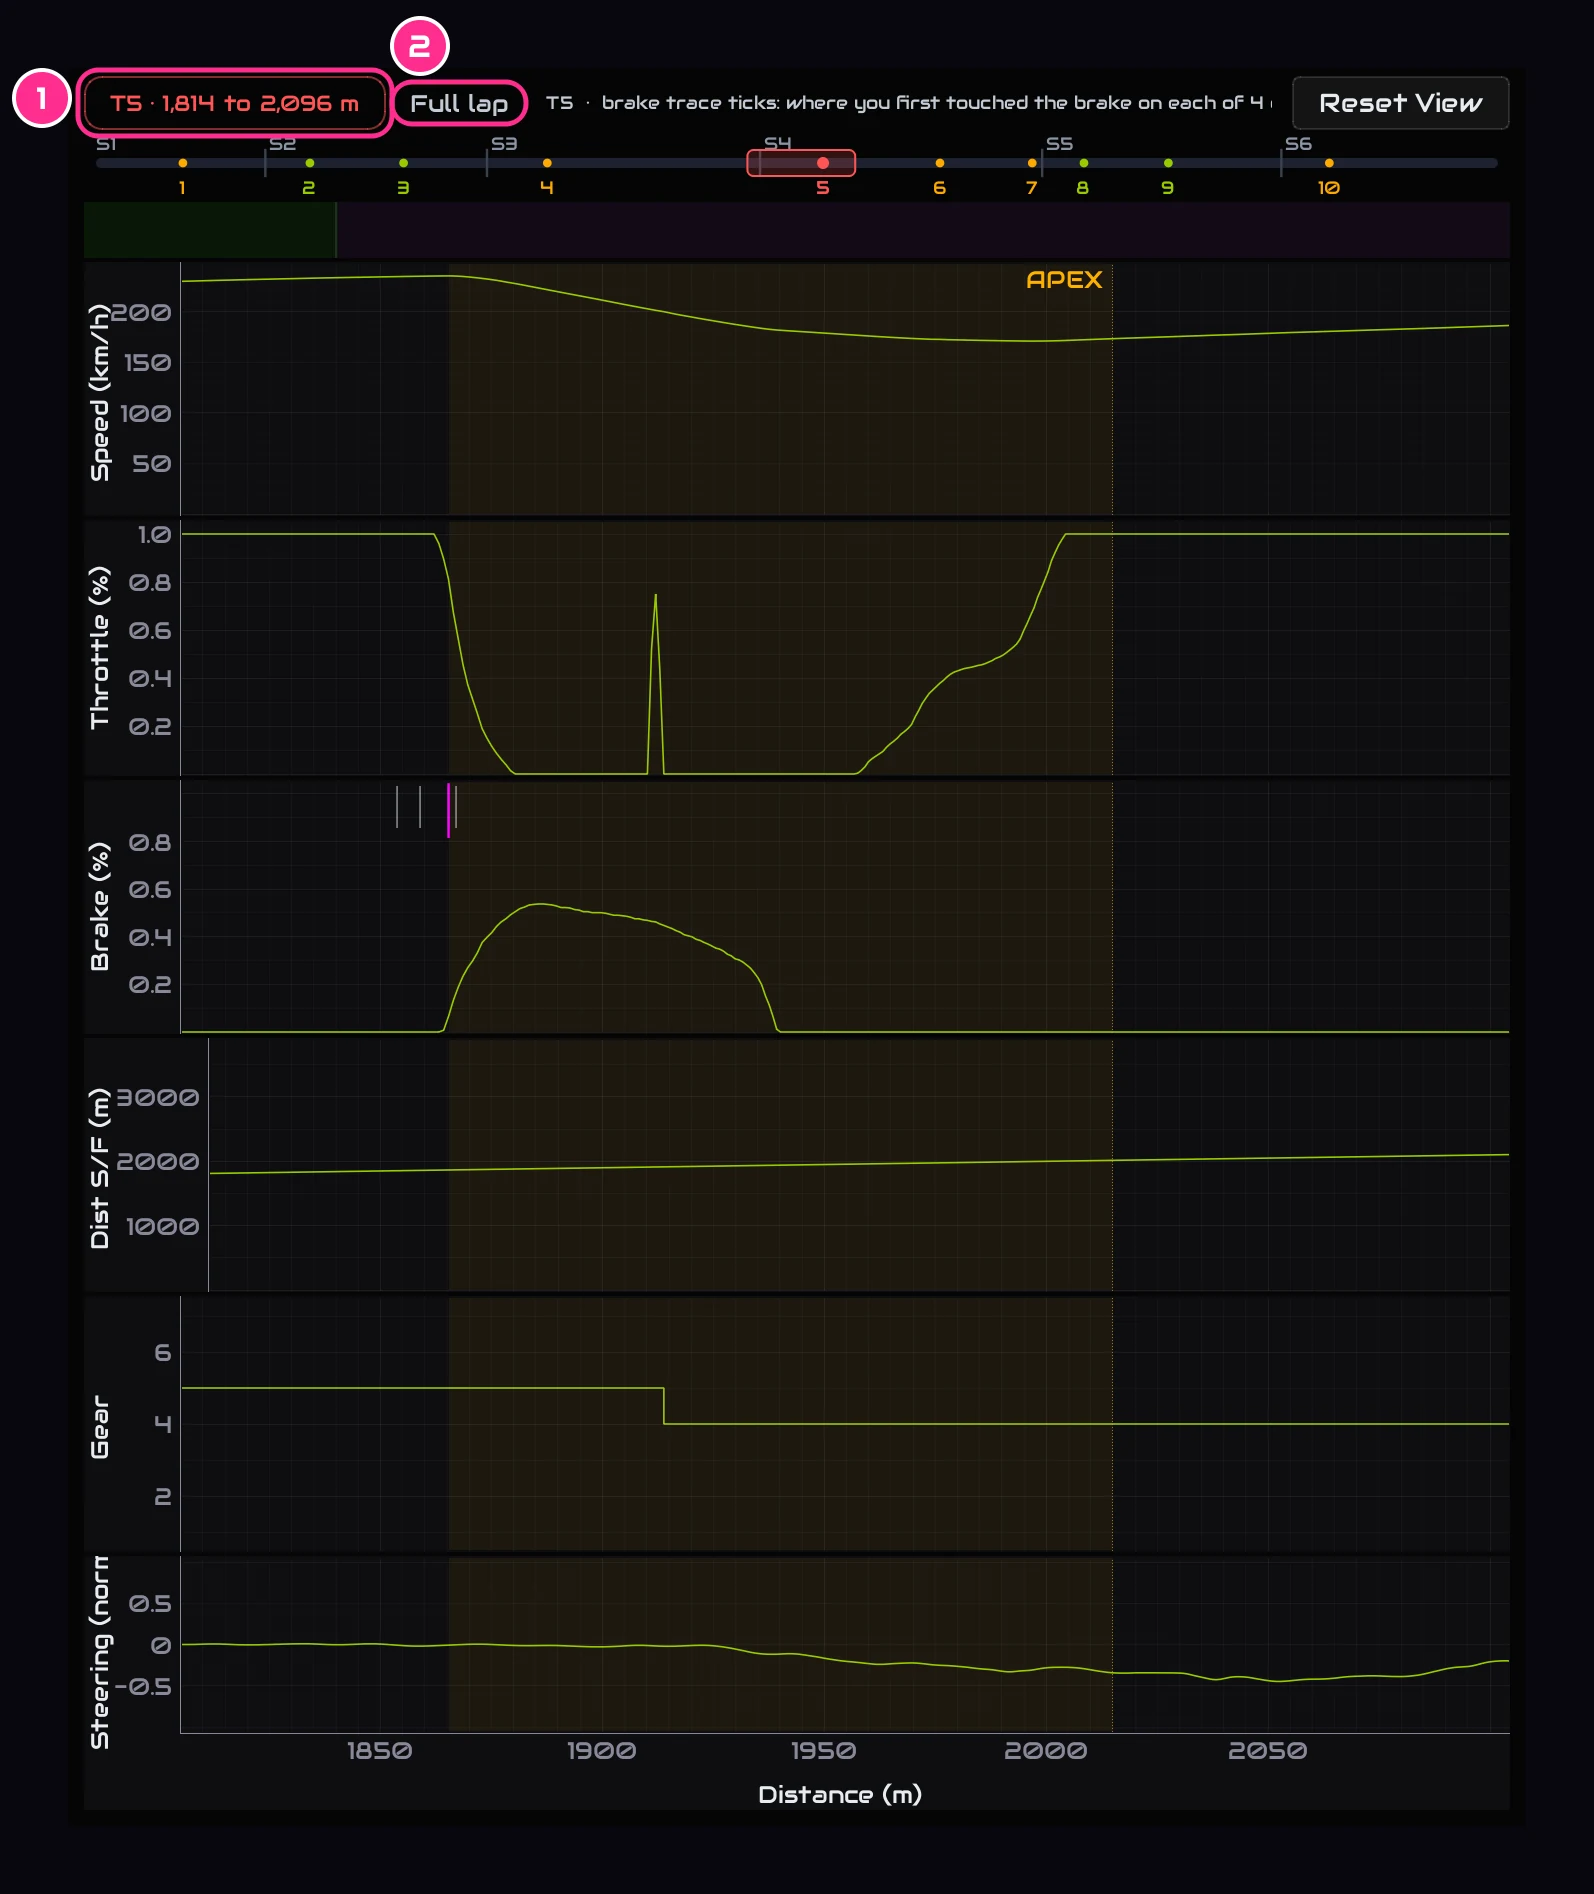
Click a corner's number on the map, its chip in Corner coaching, or its dot on the strip above the traces. The map and the traces zoom to it, and its coaching opens under the map.
- 1The cornerWhich one, and the stretch of track on screen.
- 2Full lapZooms back out.
On the traces, the dashed line is the apex and the shaded band is the braking zone. On the brake trace, each short tick is where you first touched the brake on one clean lap; the pink one is the lap on screen. Ticks spread wide mean your brake point moves from lap to lap.
Two lapsCompare two laps
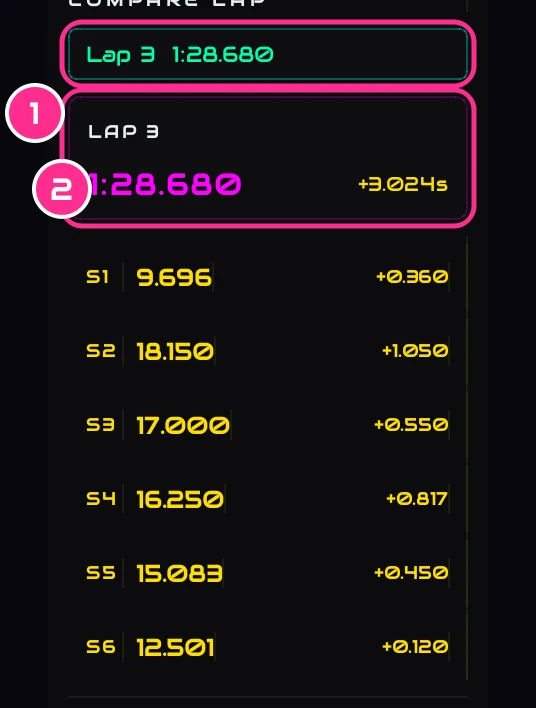
- 1Compare lapPick the lap to lay over the one on screen.
- 2Its timeAnd the gap between the two laps.
The compare lap is drawn in pink on every trace, with its own dot on the map, so you can see where the two laps part. Pick None to take it off.
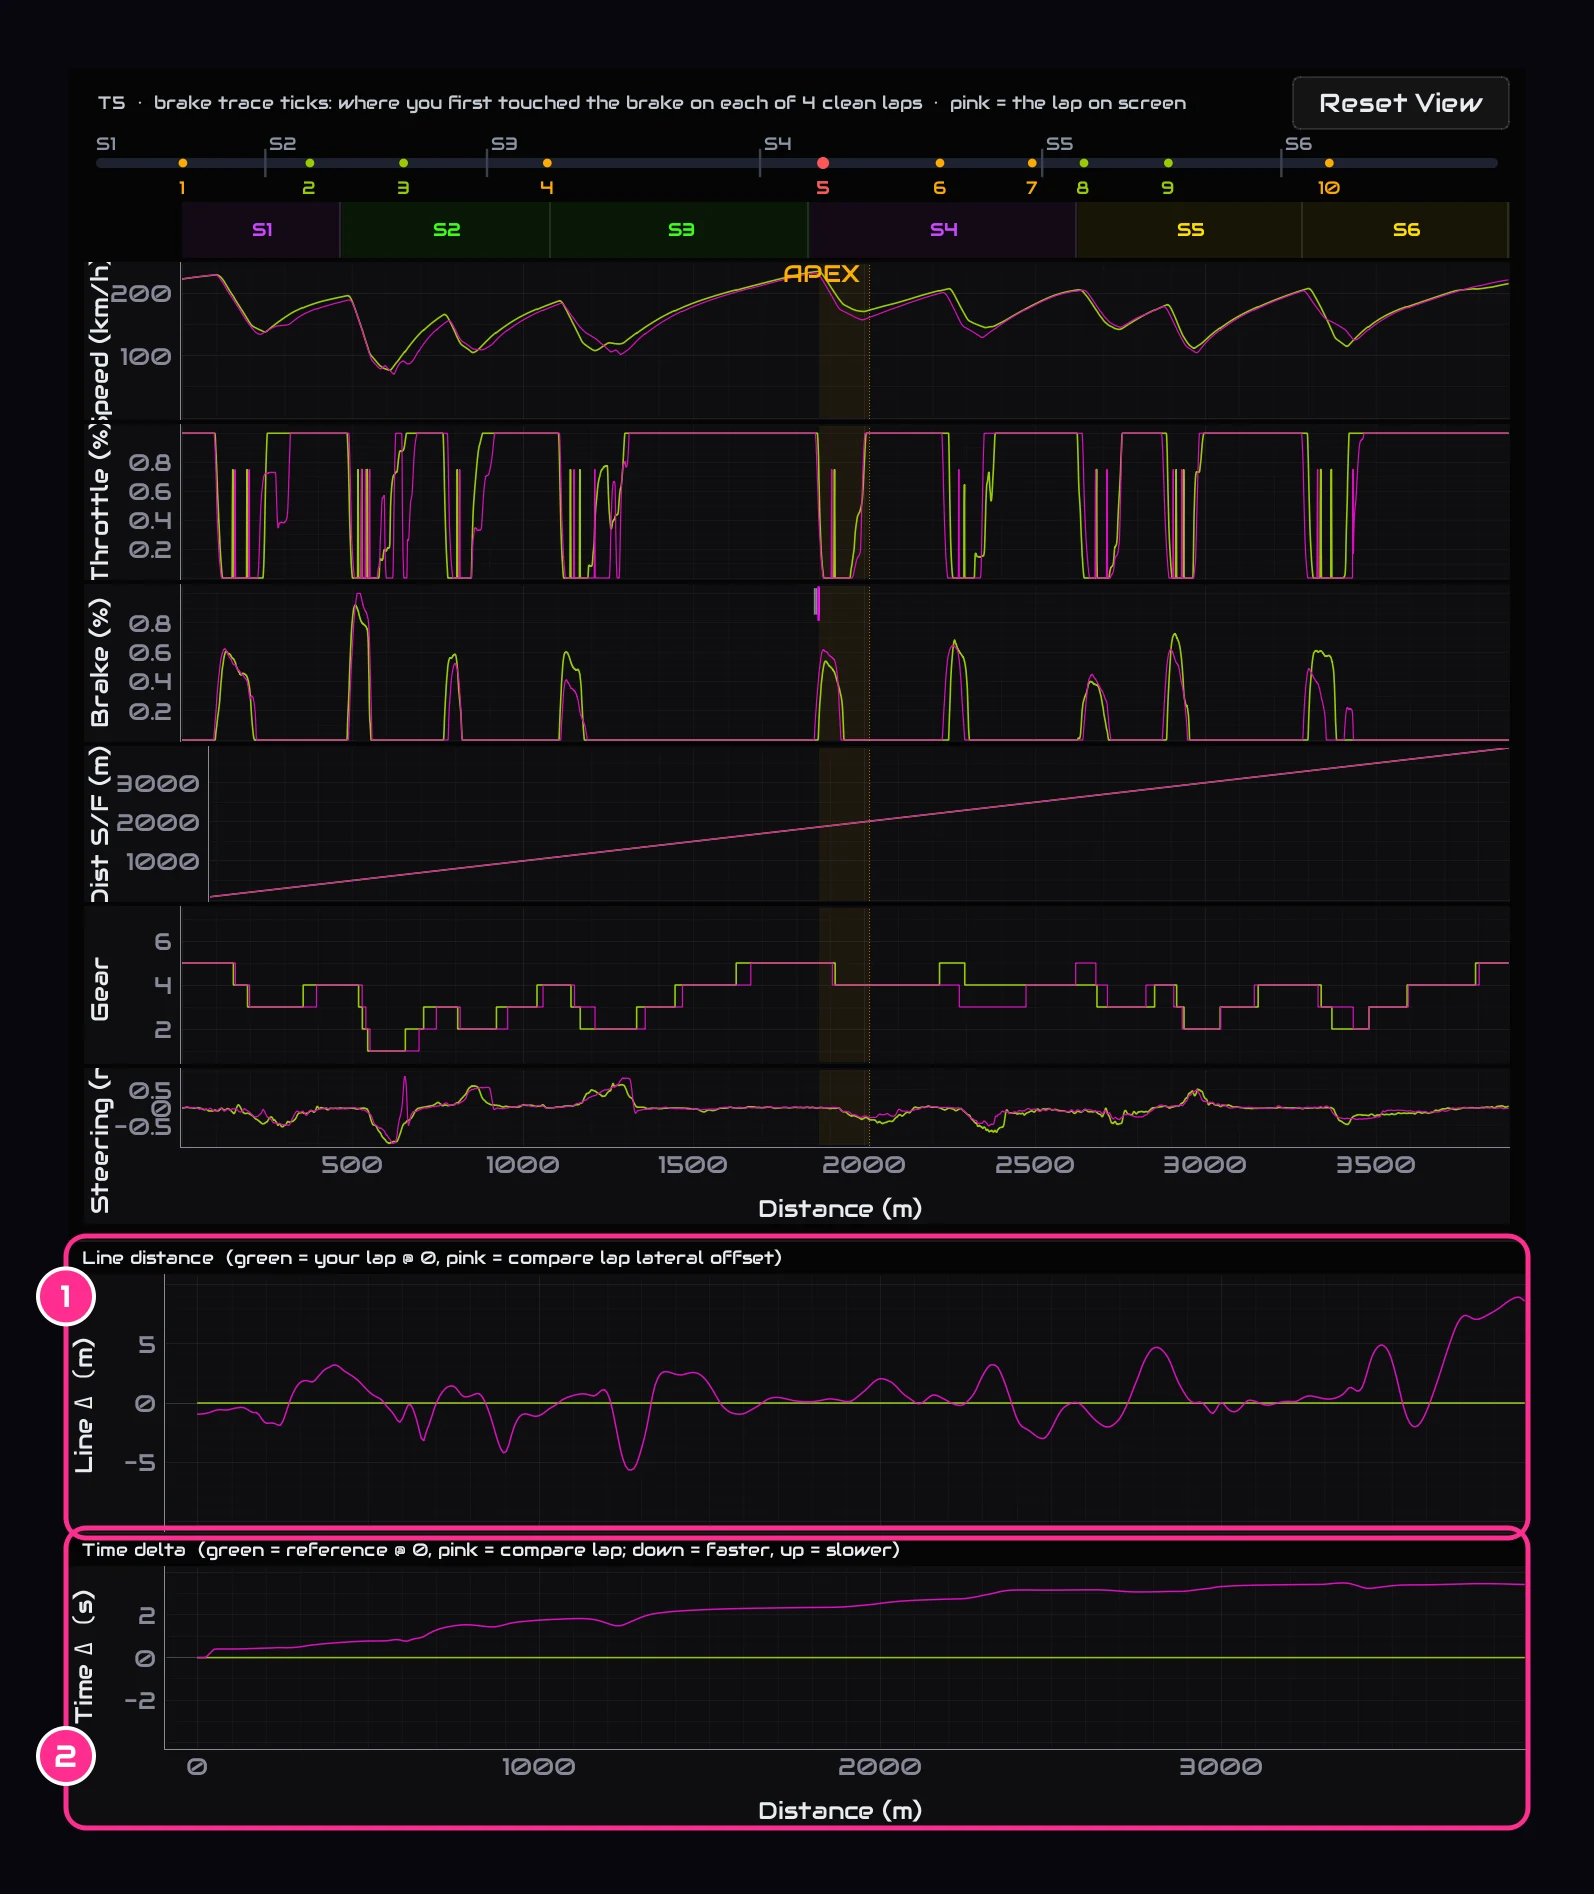
Two charts appear under the traces:
- 1Line distanceHow far to the left or right of your line the compare lap ran, in metres.
- 2Time deltaThe gap between the two laps all the way round. When the pink line climbs, the compare lap is losing time; when it falls, it's gaining.
Someone else's lapA Garage 61 lap
Export one lap from Garage 61
In Garage 61, open the lap and export it as CSV. It must be one lap, not a whole session. Keep the file name it gives you: the car, the track and the lap time are read from it.
Load it
Press Load G61 CSV under Laps and pick the file. It has to be the same car and track as the session you have open. It shows as the compare lap, with the two charts, and Clear G61 takes it off.