User Guide

AB Racing Line — User Guide

AB Racing Line is your personal race engineer for iRacing. Load a lap and it reads your telemetry the way an engineer would: it scores your driving, tells you where the time is, tunes your car to the way you actually drive, and — for endurance running — plans the race and rides with you live on the pit wall. This guide walks through the whole app, one tab at a time, in plain English: what each screen shows, where the numbers come from, and what to do with them.

On this page
  1. Getting started
  2. The Overview tab
  3. Telemetry & Track Map
  4. Race Strategy
  5. Live Pit Wall
  6. The Engineer Report
  7. Your Car Setup
  8. AB Overlays
  9. Settings
  10. FAQ

1. Getting started

AB Racing Line is a Windows app that reads iRacing's own telemetry files. There's nothing to set up inside iRacing and no plugin to install — if you've driven a session, iRacing has already saved the file the app needs.

Get the app

Subscribe at alienblade.co.uk/racingline (£3.99/month), then download and run the installer. It installs just for you — no admin rights, no Windows security prompts. The app keeps itself up to date automatically, so once it's installed you never have to download it again.

First launch

The first time you open the app you'll accept the licence, then sign in with the account you created on the website. That's the only time you'll be asked — the app remembers you after that.

Your data stays on your PC. Your telemetry never leaves your machine. The app analyses everything locally; the only thing it talks to the internet for is checking your subscription and turning your results into plain-English coaching.

Load your first lap

Click Load IBT in the top-right corner and pick a telemetry file — or just drag one straight onto the window. iRacing saves these .ibt files in your Documents \ iRacing \ telemetry folder, one per session you drive. Pick a session where you got a few clean laps in and the app does the rest.

The AB Racing Line app on first launch, showing the six tabs

The app on first launch — Load IBT top-right, and the six tabs along the top

The app needs at least two clean laps. It ignores out-laps, in-laps, laps with a spin or off-track, and anything way off your pace — those never pollute your coaching. If a file doesn't have two clean laps left after that, the app will tell you why rather than guess.

The six tabs

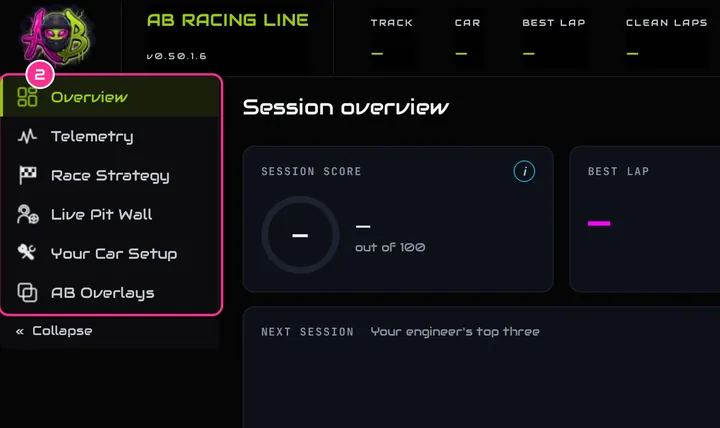
Everything the app does lives across six tabs along the top. Here's the one-line version of each — the rest of this guide takes them one at a time:

Prefer different units? The whole app can show speed, distance, temperature, pressure, fuel and weight in metric, imperial, or your own mix. Set it once in Settings and every screen follows.

2. The Overview tab

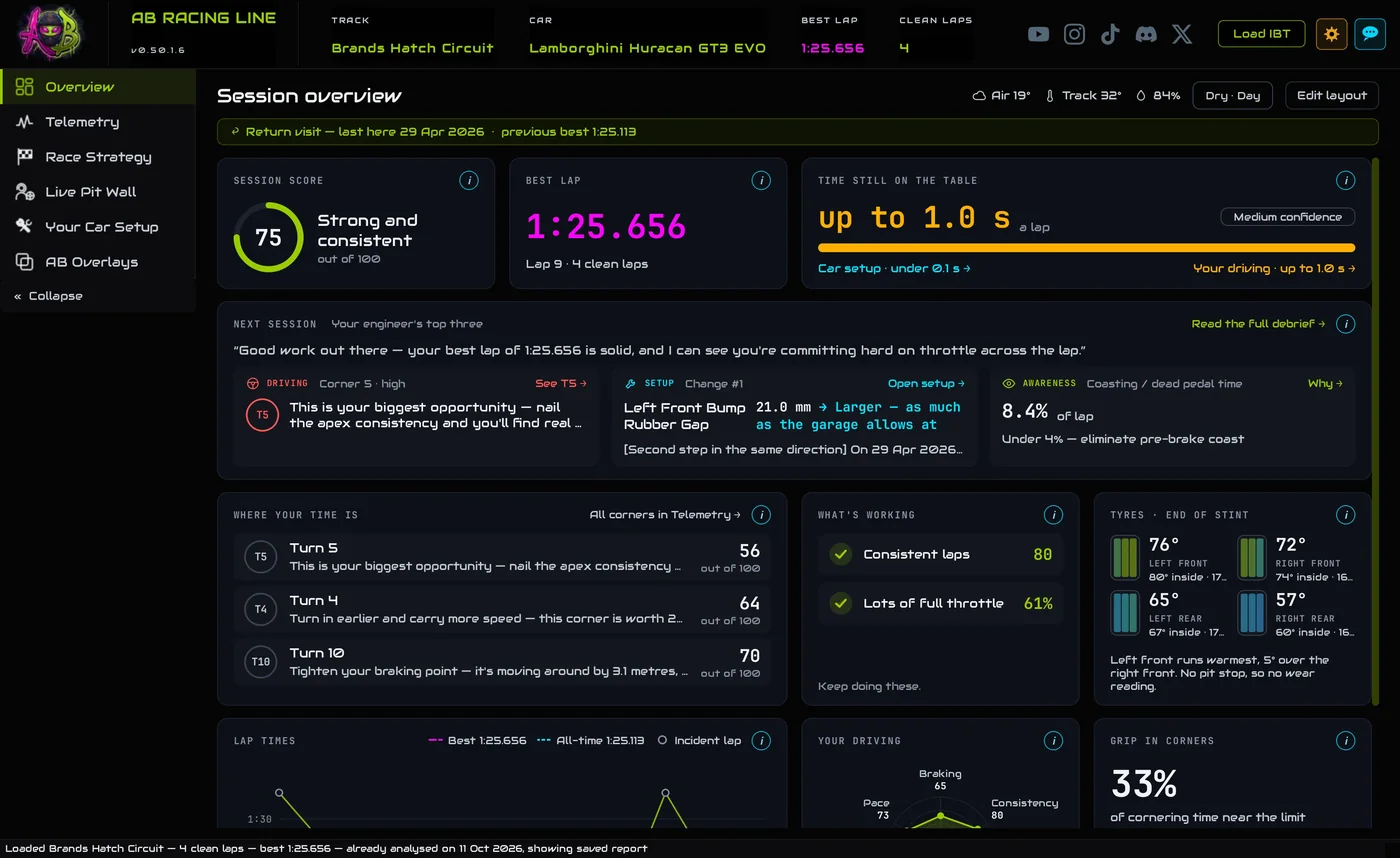
The Overview is your session at a glance. It's built around two questions a race engineer always asks: how good was this session, and where is the time. Everything on it is computed from your own laps the moment the file loads — no internet needed — so you get the full picture instantly, and the wording sharpens once the corner coaching arrives.

The full Overview tab

The Overview — success on the left, where-to-improve in the middle, your driving fingerprint below

Make the layout yours

Every panel is yours to arrange. Drag the • • • strip at the top of a panel to move it, drag the bottom-right corner to resize it, and your layout saves automatically for next time. Want the original back? Press Reset layout at the top. It's the same free-canvas idea you'll find on the Race Strategy and Live Pit Wall tabs.

Reading your session — the top row

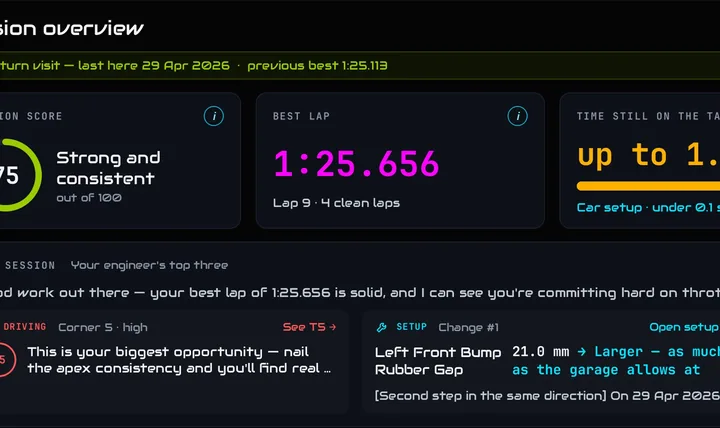
Session Summary gives you the headline: an overall score out of 100, a one-line verdict in plain English ("Strong, consistent session"), and the car and track. The score blends how fast, how consistent, and how clean your driving was — it's the single number to watch climb as you improve.

Key Stats is the factual line underneath — your best lap, how many clean laps the app used, whether it was practice, qualifying or a race, and the time of day you ran. Next to it, Conditions shows air and track temperature, humidity, whether it was dry or wet, day or night, and which sector was your strongest and weakest.

Lap Time Potential is the one everyone looks at first: how much quicker this lap could realistically be. It splits the gain into technique (time you'd find by driving) and setup (time you'd find by tuning the car), each as an honest range rather than a single flattering number. There's a full breakdown of how it's worked out in the Time Gains guide.

Where the time is

Where to Improve is your worklist, worst first. It ranks your weakest corners by score and then your biggest habits that cost time — coasting (rolling off the throttle before you brake) and full-throttle time — each shown as real seconds you could save. When the corner coaching arrives, these headlines sharpen into specific advice.

What Went Well is the other half of the story — the things you're already doing to a high standard, so you know what not to change. A good session leans on your strengths and chips away at the list next door.

Your driving fingerprint

The bottom row is about how you drive, not just how fast. The Friction Circle is the app's most information-dense picture: every dot is a moment on track, plotted by how much the car was accelerating, braking and cornering. The green ring is the grip limit; how much of that circle you fill is how much of the car's grip you're actually using. The readout underneath — grip used in corners, split into slow and fast corners, against a top-driver reference of ~85% — turns that picture into a number you can chase.

The Friction Circle panel

The Friction Circle — every dot is a moment on track; the green ring is the grip limit

Driving Style is your fingerprint as a radar — trail braking, consistency, braking, pace, smoothness and throttle. It's not a scorecard of good and bad; it's a portrait of the driver you are, and the app tunes your car to that style rather than trying to change it. Consistency plots every lap's time so you can see your rhythm — the tight cluster of a good run, or the one lap that got away.

Tyres, at a glance

Tyre Temps shows the working temperature of each tyre across its outer, middle and inner bands, in the car's own layout. It's the quick read on whether your tyres are in their window and whether they're wearing evenly across the tread — the colour scale runs from cold blue to overheated red.

The Tyre Temps panel

Tyre Temps — outer / middle / inner working temperature per corner

See the little ⓘ on every panel? Click it for a plain-English explanation of what that panel is showing and how to read it — it slides in from the side and closes when you click away. Every panel in the app has one.

Coming back to a track

When you load a session for a car and track you've run before, the Overview adds a verdict banner comparing this run to your last one — quicker or slower, more or less grip — always comparing like with like (a dry run against your best dry run, a wet run against your best wet run). It's how you see whether a setup change or a bit of practice actually moved you forward. For a long endurance run, a view selector lets you drill into any single stint instead of the whole race.

3. Telemetry & Track Map

The Telemetry tab is your lap in detail — the track map on the left, your traces on the right, and everything synced together. Pick a lap on the far left and the whole tab redraws around it.

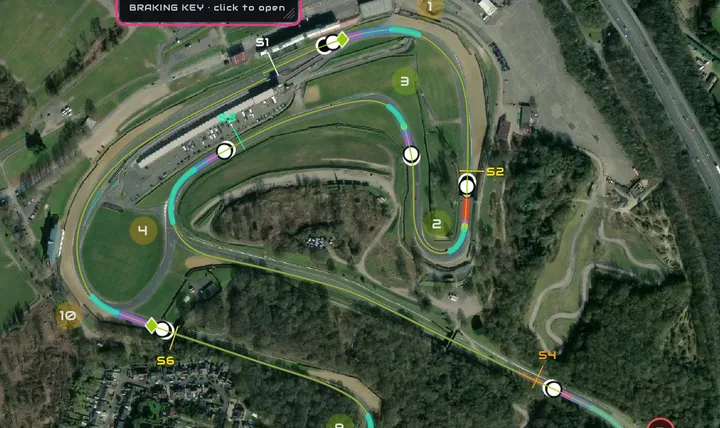
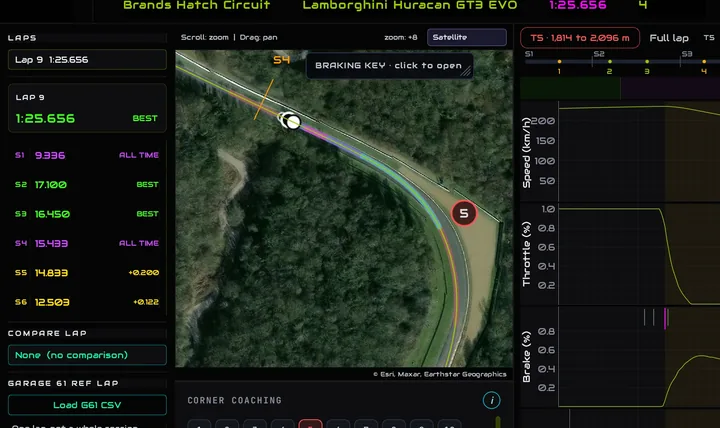
The Telemetry tab — track map with braking, and the trace channels

The Telemetry tab — your racing line with braking on the left, your traces on the right

The lap list

On the left is every lap you completed. Your fastest clean lap is highlighted, and any lap with a spin or off-track shows in red as an incident — those are shown so you can find them, but never used in your coaching. Underneath sit your sector times, a Compare Lap picker, and a Load G61 CSV button for pulling in a Garage 61 reference lap.

The track map

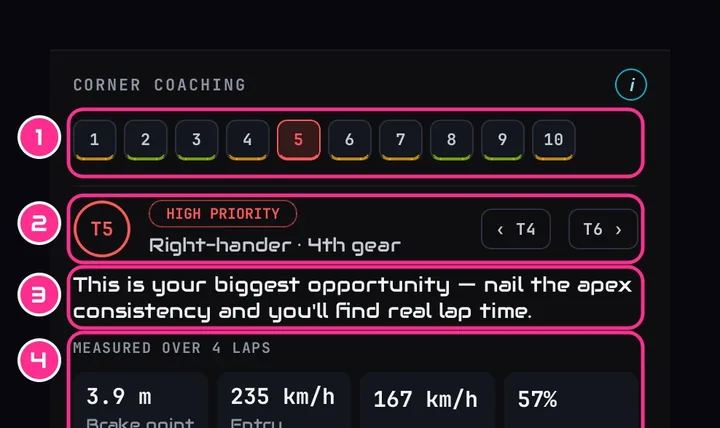
The map is your actual GPS line, laid over a real map of the circuit — switch the background between Dark, Satellite, Street and Terrain with the style dropdown. Corner numbers and sector markers are placed automatically. Click any corner number and a popup shows that corner's coaching (the same advice as the Engineer Report).

The braking layer — where and how hard you brake

This is the part no lap chart shows you. Your racing line is coloured by how hard you're actually pressing the brake — yellow through red as pressure builds, and cyan where you're trailing off. And for each corner there are two markers: a hollow ring where you first touch the brake, and a filled dot where you're really braking. The gap between them is your feathering — the time you give away easing onto the pedal before you commit, which on most cars is the biggest, safest gain available. A green diamond marks a later brake point you've already proven you can hit, and only ever appears where your own data shows you have the grip in hand.

Every number is yours. The braking layer is built entirely from what you did in this session — there's no invented "ideal line" for you to chase. Where the app can't prove you have headroom, it says nothing rather than send you into the gravel.

The traces

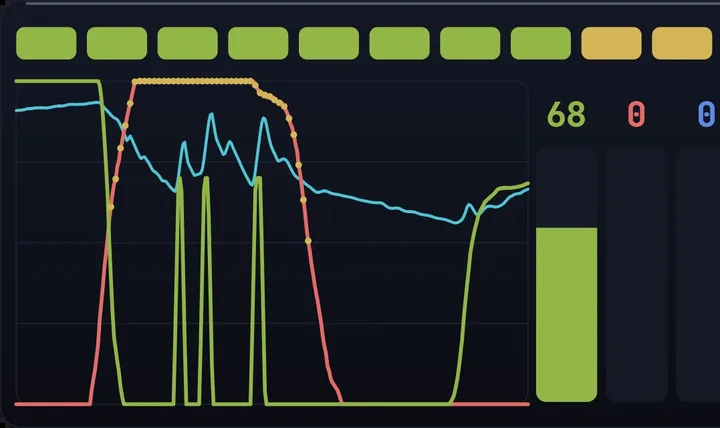
On the right are your Speed, Throttle, Brake, distance-from-start/finish, Gear and Steering channels, plotted against distance round the lap. Hover anywhere and a crosshair tracks across every trace at once, with a matching dot on the track map — so you can read exactly what your hands and feet were doing at any point on the circuit. Click a sector to zoom every trace and the map to it; drag a box to zoom in on anything.

Comparing two laps

Pick a Compare Lap (one of your own, or a loaded Garage 61 lap) and it overlays in pink on the map and every trace, and two comparison charts appear: a line-distance chart showing where your two lines differ across the track, and a time-delta chart showing where you're gaining and losing — green where you're quicker, red where you're slower. It's the fastest way to see exactly where a faster lap was actually faster.

4. Race Strategy

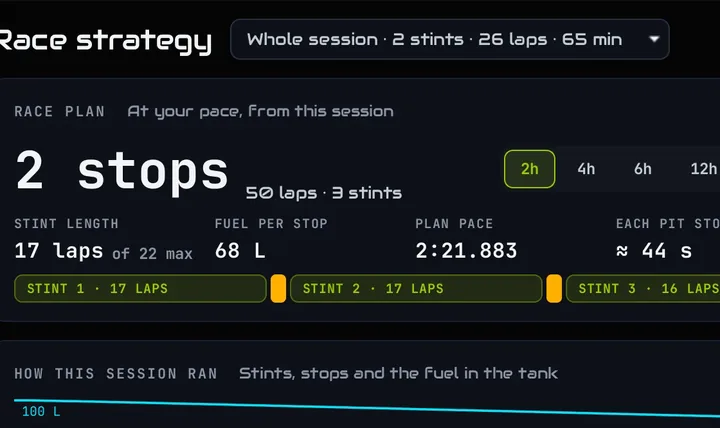
Load an endurance session — a race, or any long run with a pit stop — and the Race Strategy tab turns it into the briefing a race engineer would hand you. Everything on it is computed from your own telemetry: it describes what actually happened, so you can plan the next race on facts rather than guesswork. It appears automatically whenever a session qualifies as endurance running.

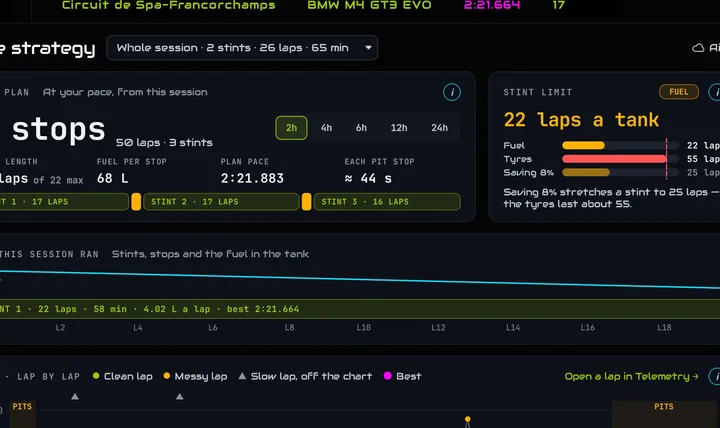
The full Race Strategy tab

The Race Strategy tab — the decisions up top, the evidence charts below

Like the Overview, every panel is a free canvas — drag the • • • strip to move a panel, drag its corner to resize, and press Reset layout to get the original back.

The summary strip and what limits you

The strip along the top is your one-line health check: session length, total laps, how many stints, and the important one — BINDING, whether FUEL or TYRES ends your stint first. The margin readout tells you how many laps of headroom sit between the two; a small margin means both run out around the same lap and your pit window is tight.

The Bound By panel

Bound By — are you fuel-limited or tyre-limited, and how much of your pace loss is real wear

The Bound By panel goes deeper: it separates genuine tyre degradation (your lap time falling as the tyres wear, fuel-corrected) from mistakes — so you know whether you're slowing because the tyres are gone or because a couple of laps got messy.

Fuel and pace

Race-Pace Projection works out how far your fuel really goes — from your actual burn profile across the stint, not one flattering average — and how many stops that means. Race Reality is the honest version of your pace: your clean lap time next to your real race pace with traffic counted in and cautions taken out, plus a disruption budget for the laps that never go to plan.

The Fuel Strategy panel

Fuel Strategy — your fuel burning down across the race

Stints, pits and tyres

The Stint Timeline lays your stints and pit stops end to end on one row, so the shape of the race reads at a glance. The Pit Stops table lists every stop — lap, fuel added, tyres changed and any damage. And Tyres · End of Stint shows how much tread was left on each tyre and what temperature they were running.

Going deeper — lap selector and detail charts

Along the bottom, a lap selector lets you zoom every chart to a single lap, and detailed tyre temperature and pressure charts plus your driver-input traces (throttle, brake, steering and a live steering wheel) all move together on one shared timeline — hover any chart and a crosshair tracks across the lot.

Want the full detail? Every widget on this tab has its own deep-dive in the Race Strategy guide.

5. Live Pit Wall

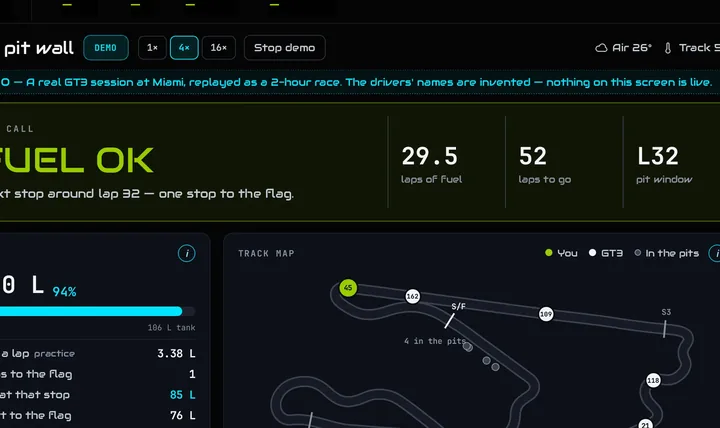
The Live Pit Wall is the same race engineering, live, while you drive. Press Go Live and the app reads iRacing in real time and leads with the thing that matters — the call. If you loaded a practice session first, it learns your fuel, tyres and pace from that and rides the whole race against it.

The full Live Pit Wall cockpit

The Live Pit Wall — the call up top, your gaps, the track and your fuel, all live

The call

The banner across the top is the decision, in plain words — fuel to the flag, pit in three, save fuel, or pit now — and it only escalates to a stop when a stop is genuinely needed. It's the number you glance at on the straight and know exactly what to do.

The live fuel panel

Live fuel — how far the tank goes against the time or laps left in the race

Your gaps — Relative and Leaderboard

The Relative board shows the cars immediately around you on track — the gap in seconds, who they are, and whether you're catching or being caught. The Leaderboard is the full field in order, with licence, iRating and class. Together they tell you where to spend effort and where a clean gap is opening up.

The track map

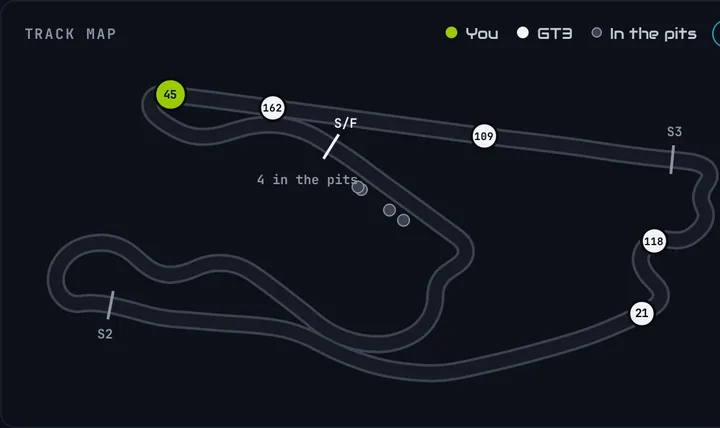
The live map shows every car on the circuit, class-coloured, with you highlighted. Here's the clever bit: iRacing doesn't broadcast live GPS, so the map draws itself from your own laps — either from the practice file you loaded, or reconstructed live from your speed and heading as you complete the first lap. A pit rejoin readout even tells you whether pitting now drops you back into clean air or straight into traffic.

The live track map

The live track map — every car placed on a map built from your own driving

Tyres — live temps, honest estimates

iRacing streams your tyre temperatures live, so those are real. It does not stream live tyre pressures — so where the app shows pressure, it's a labelled estimate built from your practice data and corrected for the live track and air temperature. The app always tells you which numbers are measured and which are estimated — it never dresses one up as the other.

Want the full detail? Every panel, the auto-baseline flow and the measured-versus- estimated rules are covered in the Live Pit Wall guide.

6. The Engineer Report

The Engineer Report is your corner-by-corner coaching, written in plain English. It reads your telemetry — brake points, apex speeds, throttle, consistency, the lot — and turns it into specific, actionable advice, the way a good engineer would talk you through your lap on the radio.

The Engineer Report

The Engineer Report — your top three fixes, the engineer's summary, then a card per corner

Your top three actions

The report opens with the three things worth your attention this session: one for your driving, one for your setup, and one for your awareness (a habit like coasting or leaving throttle on the table). It's the "if you only do three things" list.

Corner by corner

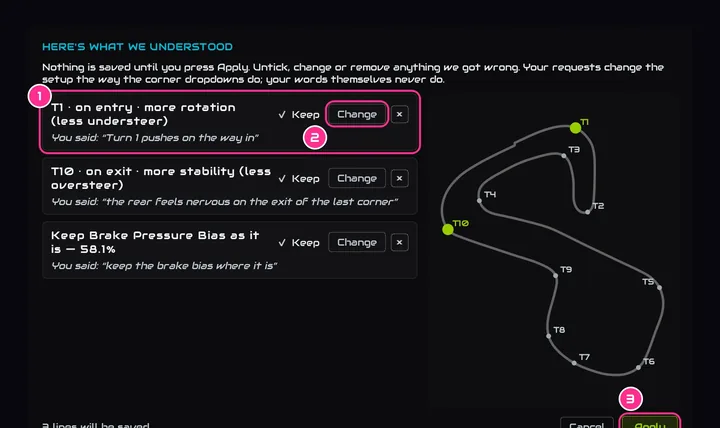
Then there's a card for every corner, marked HIGH MEDIUM or LOW priority, telling you exactly what's costing time and what to do about it — in real distances, speeds and gears, with real-world cues. Corners you're already nailing are called out too, so you know what to protect. You can also click any corner on the track map to pull up its card on its own.

It works with your style, not against it. The report will never tell you to change the kind of driver you are — a late-apex line and a diamond line can be equally fast. It refines how you execute your style, and only flags a real inconsistency, never a preference.

7. Your Car Setup

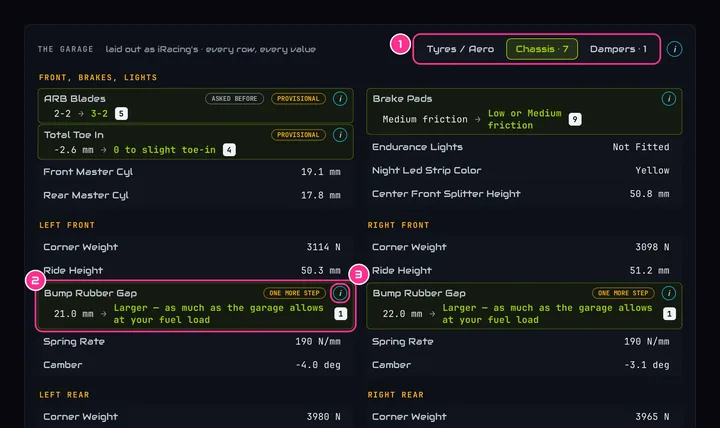
Your Car Setup lays out the car exactly like the iRacing garage — same sections, same parameter names — and marks the changes worth making in green. Every recommendation is tuned to how you actually drive, and to the specific car: it's built from real physics and your own telemetry, not a generic baseline copied off the internet.

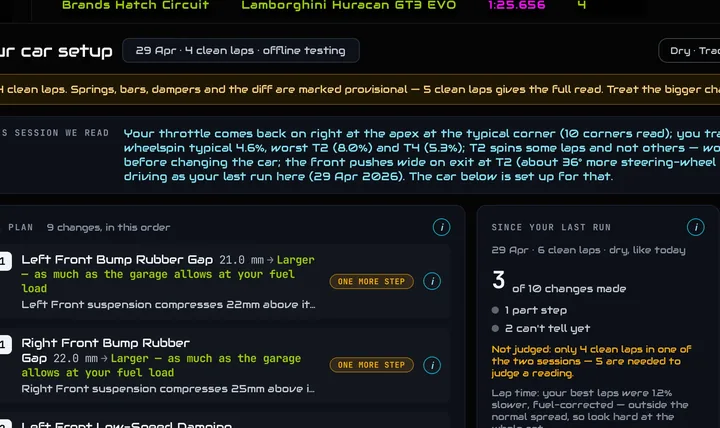
The Your Car Setup tab — Chassis

Your Car Setup — the garage layout, with recommended changes in green

Reading the recommendations

The parameters sit under the same tabs you'd find in the garage — Tyres / Aero, Chassis, Dampers — with left and right, front and rear laid out as pairs. Where a change is worth making you'll see the current value with a green → recommended next to it. Click the little beside any change and a panel slides in explaining why — what in your driving or your telemetry led to it.

Tyre pressures from real data

The Tyres tab shows the real hot pressures and tread temperatures your tyres actually ran, pulled straight from the session. Pressure recommendations come from the physics of getting the tread temperatures even across the tyre — not a number plucked from a setup sheet.

Wet weather

Run a wet session and the app builds a dedicated wet setup, and a Dry / Wet toggle appears so you can flip between the two. The wet recommendations lead with the balance changes that actually help in the rain, tuned to how you drive when it's slippery.

Confidence and balance

The more clean laps the app has, the more confident it is — with only a handful of laps, the bigger changes are marked Provisional so you know to treat them as a starting point. And a Balance Check looks at all the changes together as a package, so you're never handed two changes that fight each other — plus a sensible order to apply them in.

8. AB Overlays

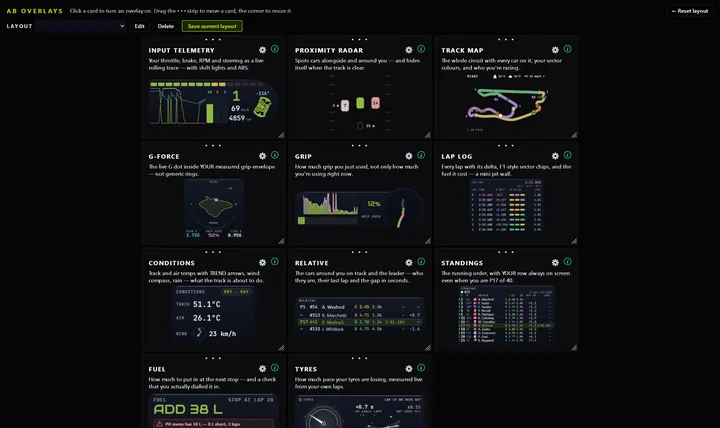
The AB Overlays tab holds nine overlays that sit on top of iRacing while you drive: your inputs, a proximity spotter, a live track map, a G-force pad, a lap log, conditions, a relative, the standings, and a fuel calculator. They are all off by default — click a card to turn one on, and it comes back automatically every time you launch the app.

The AB Overlays tab

Click a card to enable that overlay; the ⓘ explains it without leaving the app

Overlays follow iRacing on their own — they appear when telemetry starts arriving and hide a few seconds after it stops, so they are never sitting on your desktop between races. Press Move / Resize overlays to drag and resize them (they are click-through while you drive, so they can never steal a click), save named layouts for different cars, and set a keyboard shortcut that hides and shows the lot while iRacing is in front of you.

iRacing must be in windowed or borderless mode — nothing can draw over a game in exclusive fullscreen. That is true of every overlay tool, not just this one.

Each overlay, what it shows, how to read it and where it deliberately stays silent rather than guess is covered in the full Overlays guide.

9. Settings

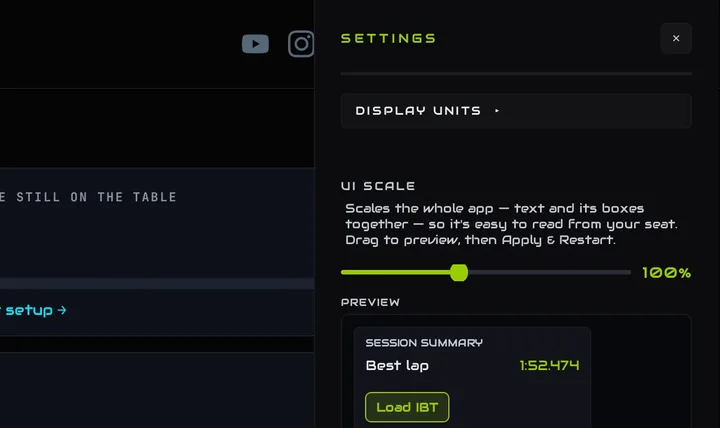
The gear icon in the top-right opens Settings, a panel that slides in from the side. Change anything you like, then press Save.

The Settings panel

Settings — display units, text size and your account

10. FAQ

Where does iRacing keep its telemetry files?

In Documents \ iRacing \ telemetry, as .ibt files — one per session you drive. If the folder's empty, telemetry saving may be switched off: in iRacing, it's the "disk" telemetry option (you can also toggle it in-car with Alt+L).

What counts as a clean lap?

A properly completed lap with no spin or off-track and a sensible time. The app throws out out-laps, in-laps, pit laps, incident laps and anything well off your pace before it analyses anything — so your coaching is never skewed by a lap that got away.

Why does it need at least two clean laps?

Almost everything the app tells you is about consistency — how much your brake point or apex speed moves from lap to lap. That needs at least two clean laps to measure. One lap can be shown, but it can't be coached.

What does the time-gain number mean?

It's how much quicker your lap could realistically be, split into what you'd find by driving and what you'd find by tuning the car — each as an honest range, not a single number. There's a full explanation in the Time Gains guide.

Does my telemetry leave my PC?

No. Your driving data is analysed entirely on your own machine. The app only talks to the internet to check your subscription and to turn your results into plain-English corner coaching.

Which cars and tracks does it work with?

Any car and any track in iRacing. The deepest, car-specific setup advice comes from the cars we've built detailed profiles for, and that list keeps growing — but every car gets physics-based recommendations and full driving coaching.

Do I need to do anything special in iRacing?

No plugins, no in-sim setup. Drive your session, then load the file. For the Live Pit Wall the app reads iRacing live while you drive — again with nothing to configure, just have iRacing running.