Race Strategy
Load a long run (a race, a long practice, anything of 30 minutes or more, or any session with a pit stop) and Race Strategy turns it into the plan an engineer would hand you before a race: how many stops, how many laps each stint, how much fuel to add, what ends a stint, and how your pace really held up once traffic and mistakes are counted.
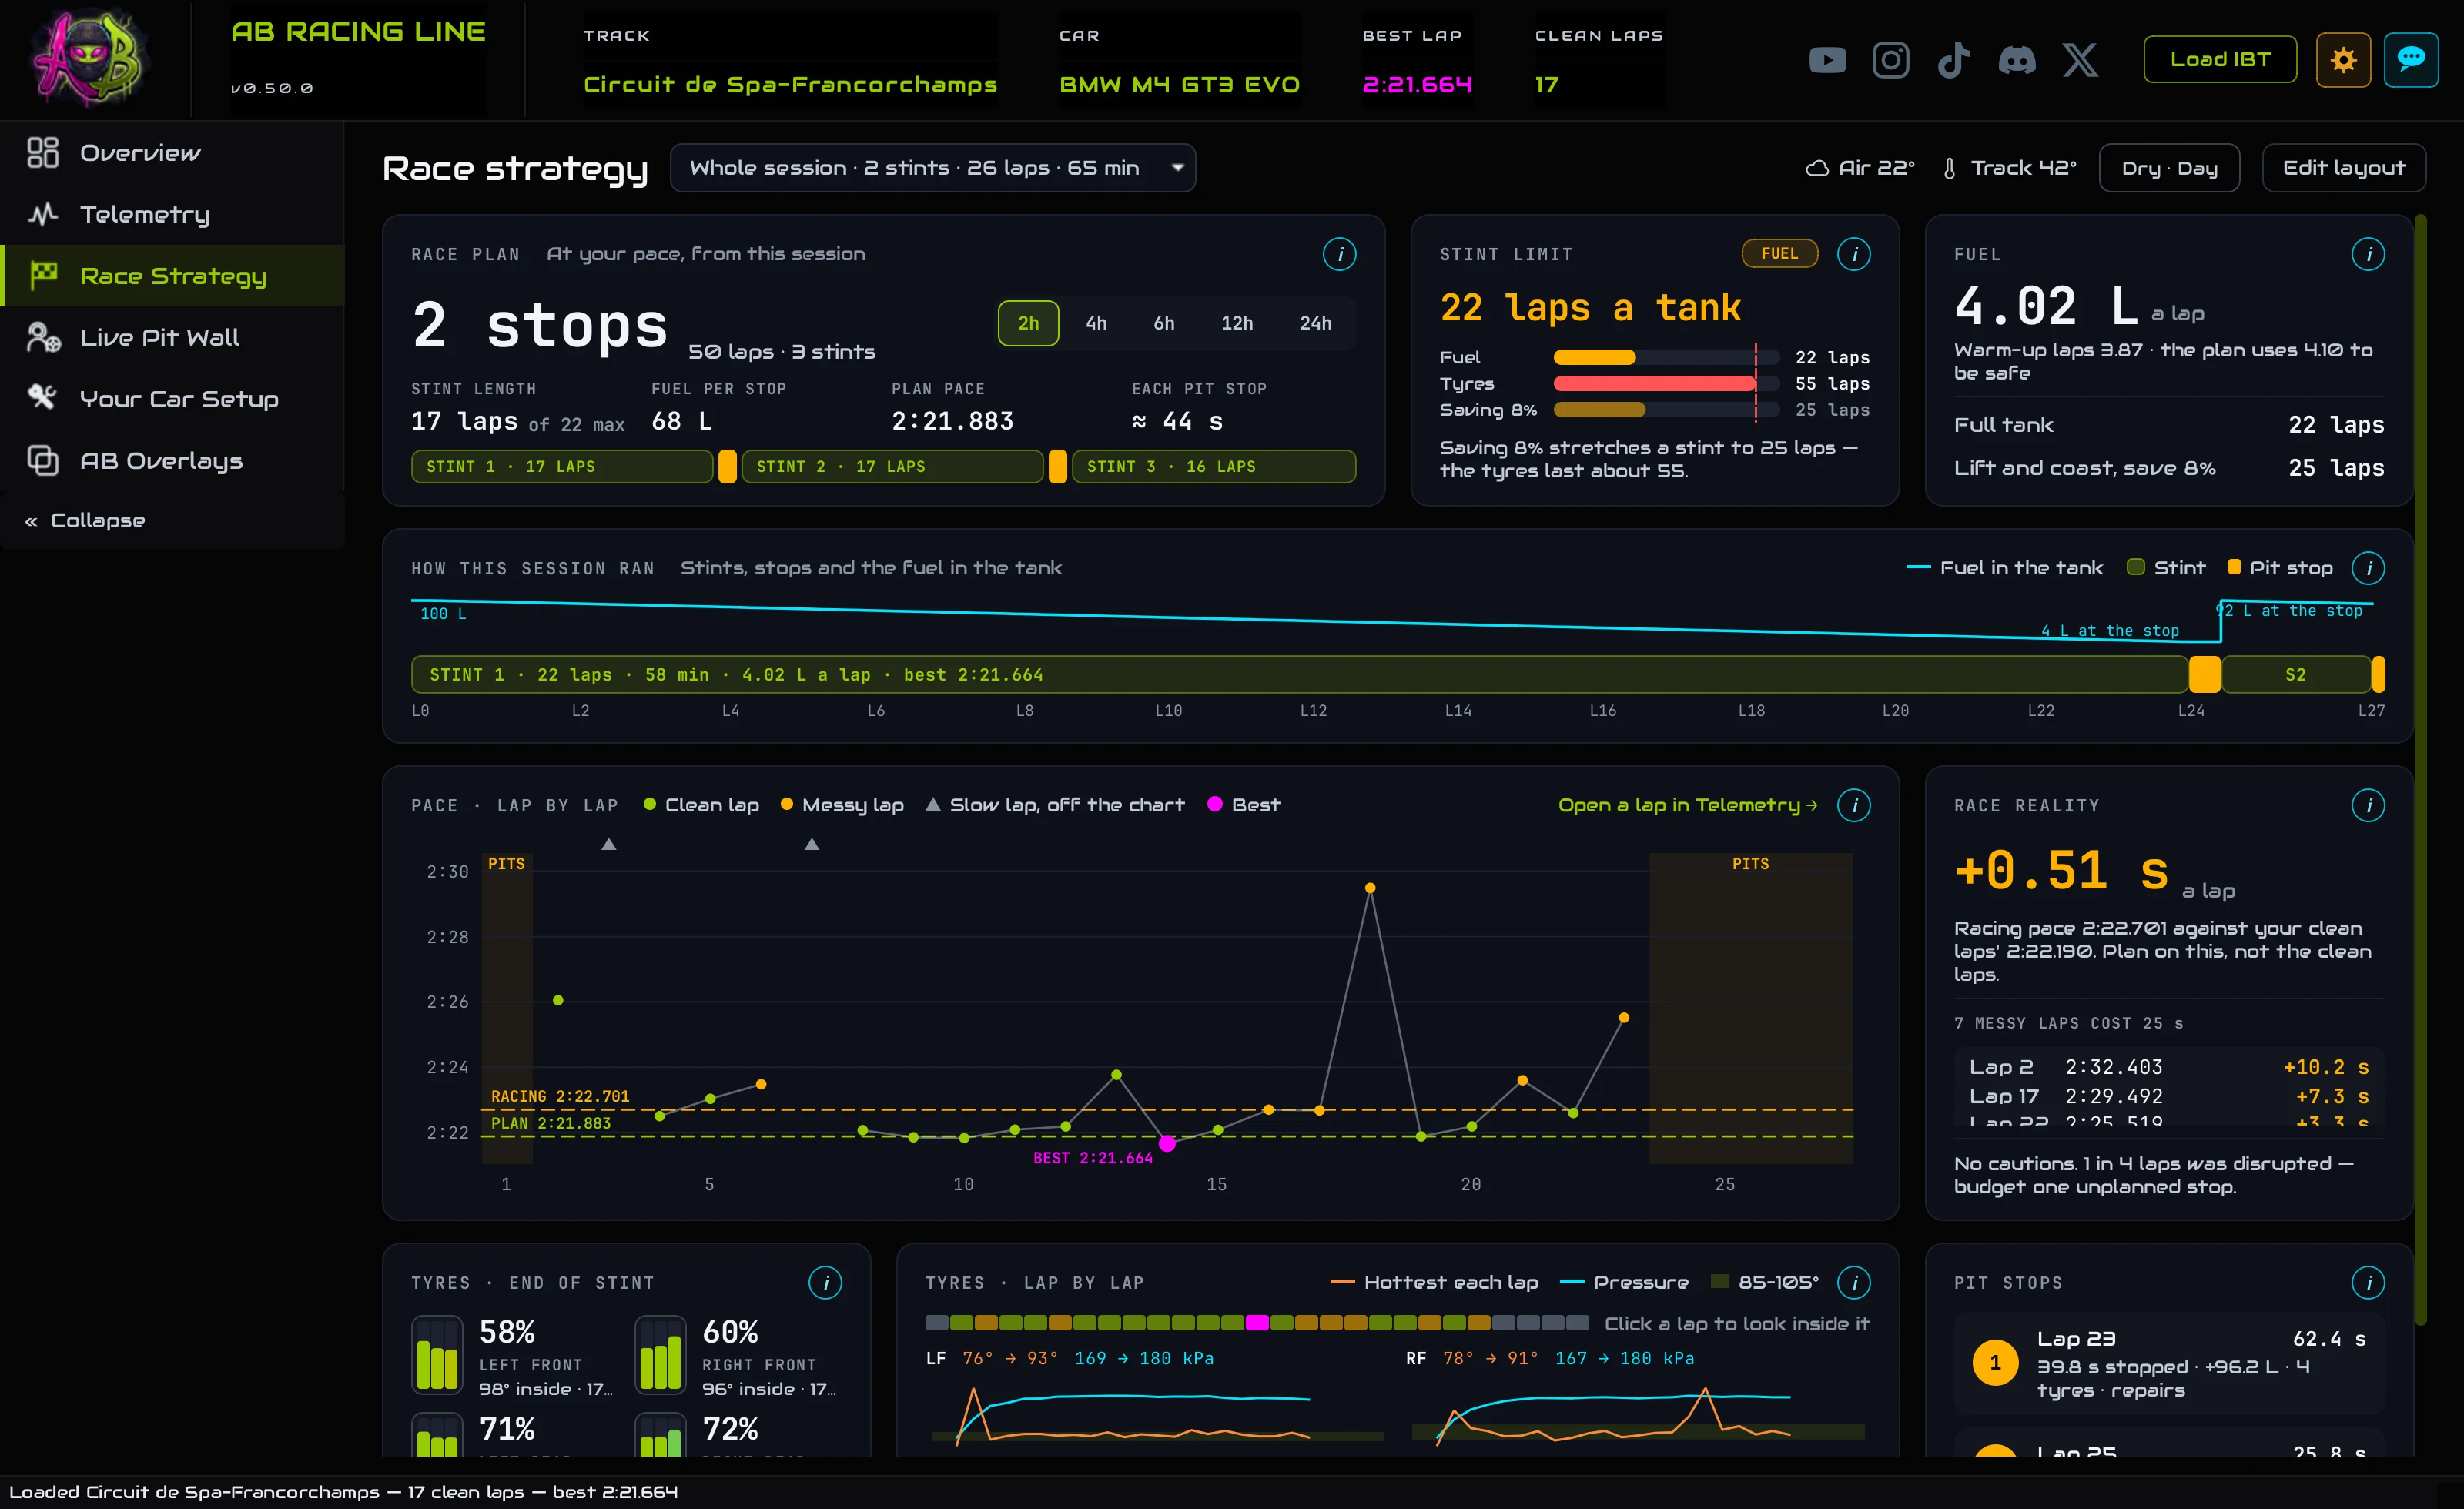
- Load a long practice (30 minutes or more, ideally with a pit stop) and open Race Strategy.
- On Race plan, pick the race length: you get the stops, the laps for each stint and the fuel to add.
- Stint limit tells you what ends a stint, the fuel or a tyre.
- Plan around Race reality, your pace with traffic and mistakes counted, not your best clean laps.
OverviewThe tab at a glance
Everything on this tab comes from your own telemetry: it describes what actually happened in this session, so you can plan the next race on facts rather than hope. The plan is at the top and the evidence below it.
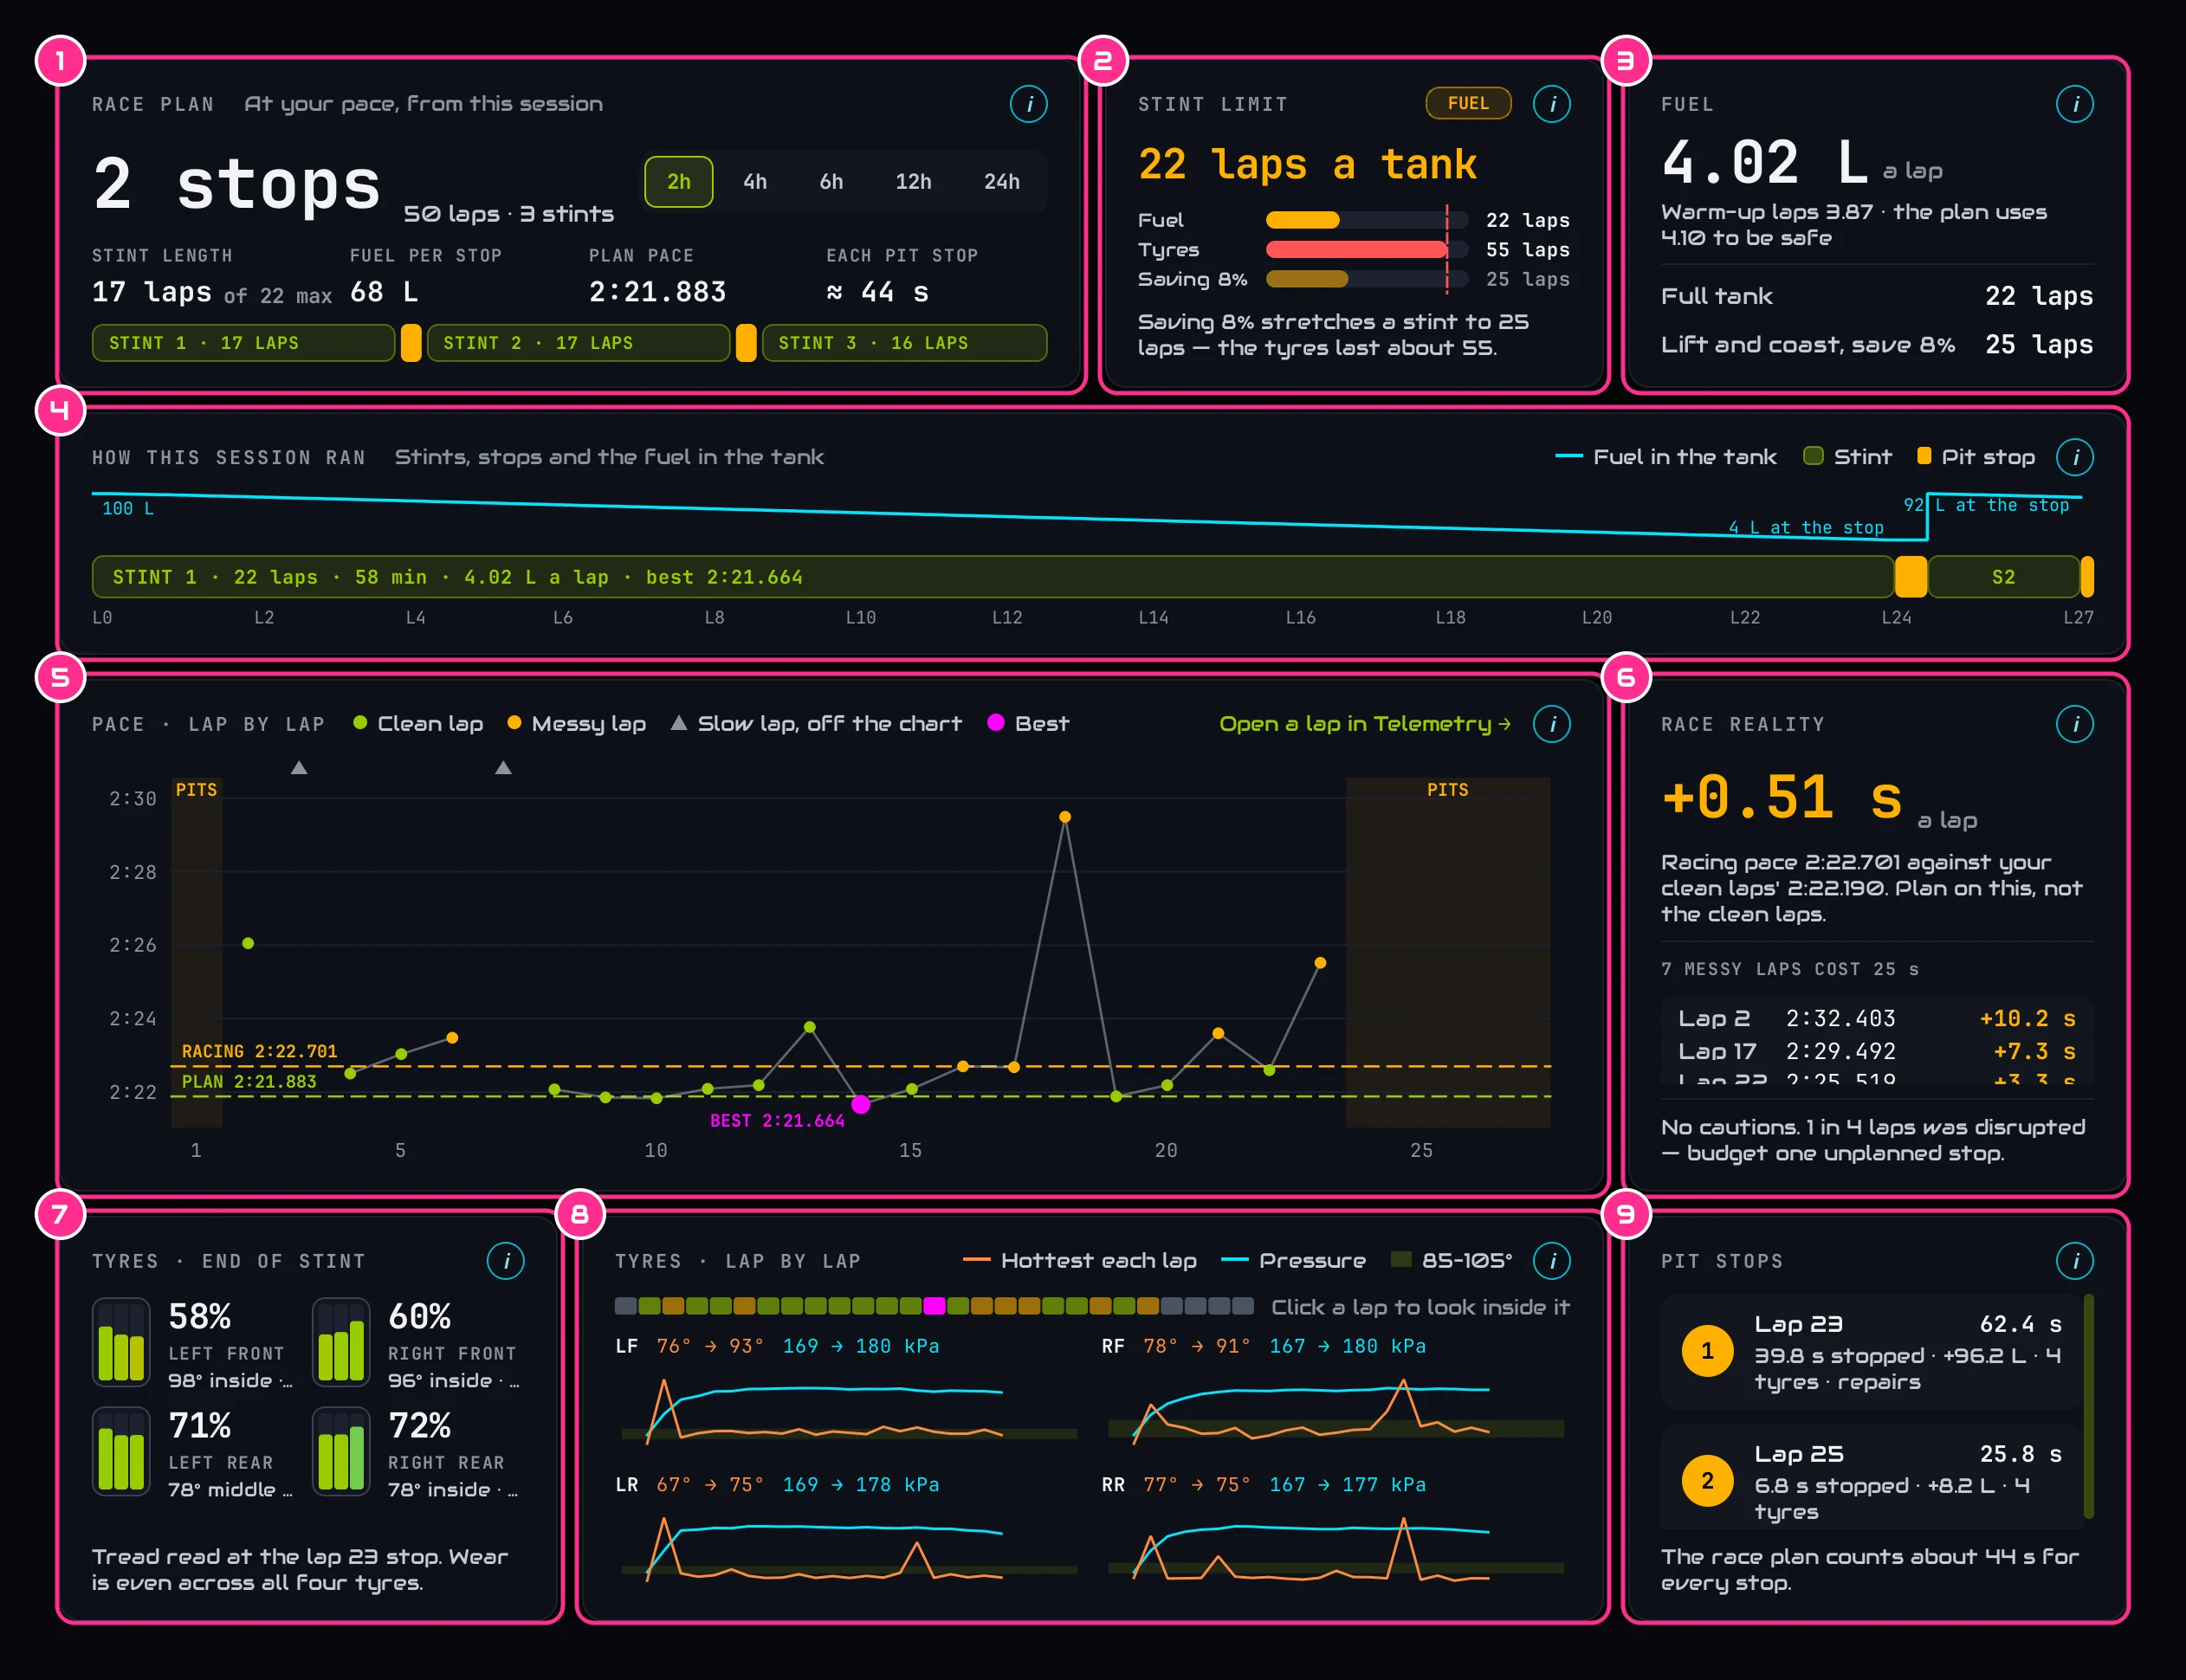
- 1Race planThe stops, the stints and the fuel for the race length you pick.
- 2Stint limitWhat ends a stint: the fuel, or a tyre.
- 3FuelYour burn per lap, and what a full tank gives you.
- 4How this session ranStints, stops and the fuel in the tank, on one line.
- 5Pace, lap by lapEvery lap you drove, clean and messy.
- 6Race realityYour pace with traffic and mistakes counted.
- 7Tyres · end of stintEach tyre when you pitted.
- 8Tyres · lap by lapHow hot each tyre got, and its pressure.
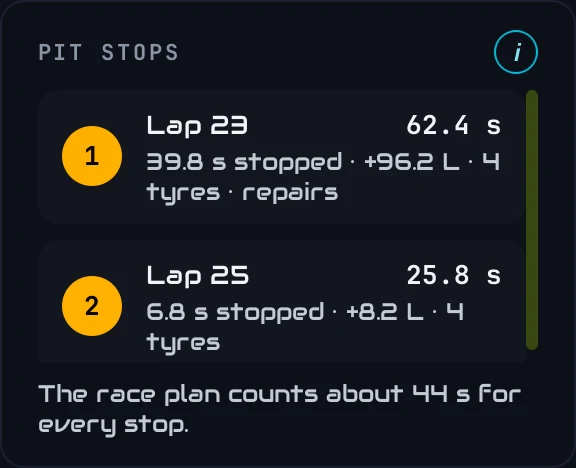
- 9Pit stopsEvery stop: what it cost, the fuel and the tyres.
The selector at the top shows the whole session or any single stint on its own. Every card has an i that explains it, and Edit layout lets you move and resize the cards: press Done when you're finished, and Reset layout brings the original back.
The planRace plan
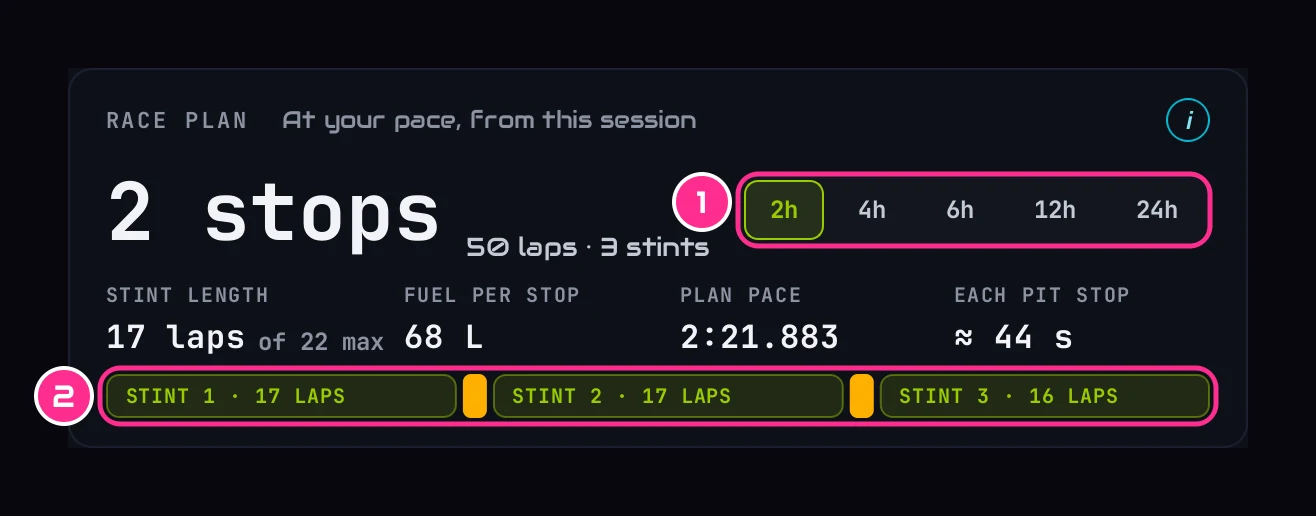
- 1Race length2, 4, 6, 12 or 24 hours.
- 2The stintsEach stint's laps, with the stops between them.
Pick a race length and the card plans it from this session:
- Stops and stints: how many pit stops the race needs, and the laps in each stint.
- Stint length: the laps to aim for each stint, and the most a stint can run.
- Fuel per stop: how much to add at each stop.
- Plan pace: the lap time the plan assumes, your quicker clean laps on light fuel. That makes it the best case; Race reality shows what traffic cost you.
- Each pit stop: what a stop costs, from your own stops in this session.
The stint length is set by whichever runs out first, the fuel or the tyres.
What ends a stintStint limit
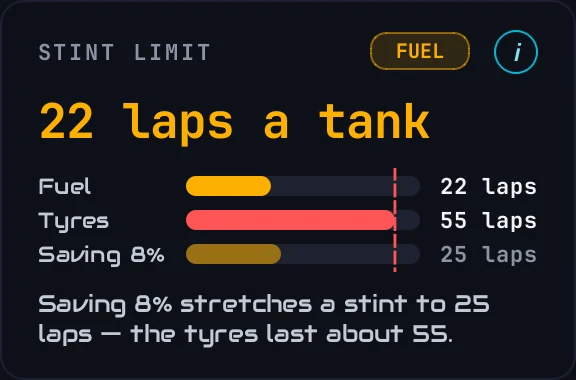
The card that shapes the whole race: what ends a stint, FUEL or TYRES. The bars show how many laps a full tank lasts, how many laps the most-worn tyre lasts, and how far the tank goes if you lift and coast. If a tyre is done first, saving fuel won't make the stint any longer, and the card says so rather than suggest it.
FuelFuel
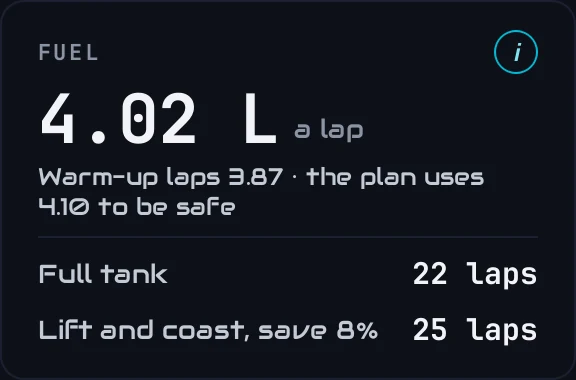
Your fuel use per lap once the car has settled, from every stint in the session (the first two laps of each stint are left out). The warm-up figure is the first laps of the first stint, when the tank is heaviest. Underneath: how many laps a full tank gives you, and how many if you lift and coast.
The plan adds a small safety margin and always keeps two laps in reserve, so the full-tank figure is laps you can actually run.
The sessionHow this session ran

The whole session on one line, in time order: each green block is a stint (with its laps, time, burn and best lap) and each amber block a pit stop. The blue line is the fuel in the tank, falling through a stint and jumping back up when you refuel. The lap numbers underneath mark where each lap started.
Every lapPace, lap by lap
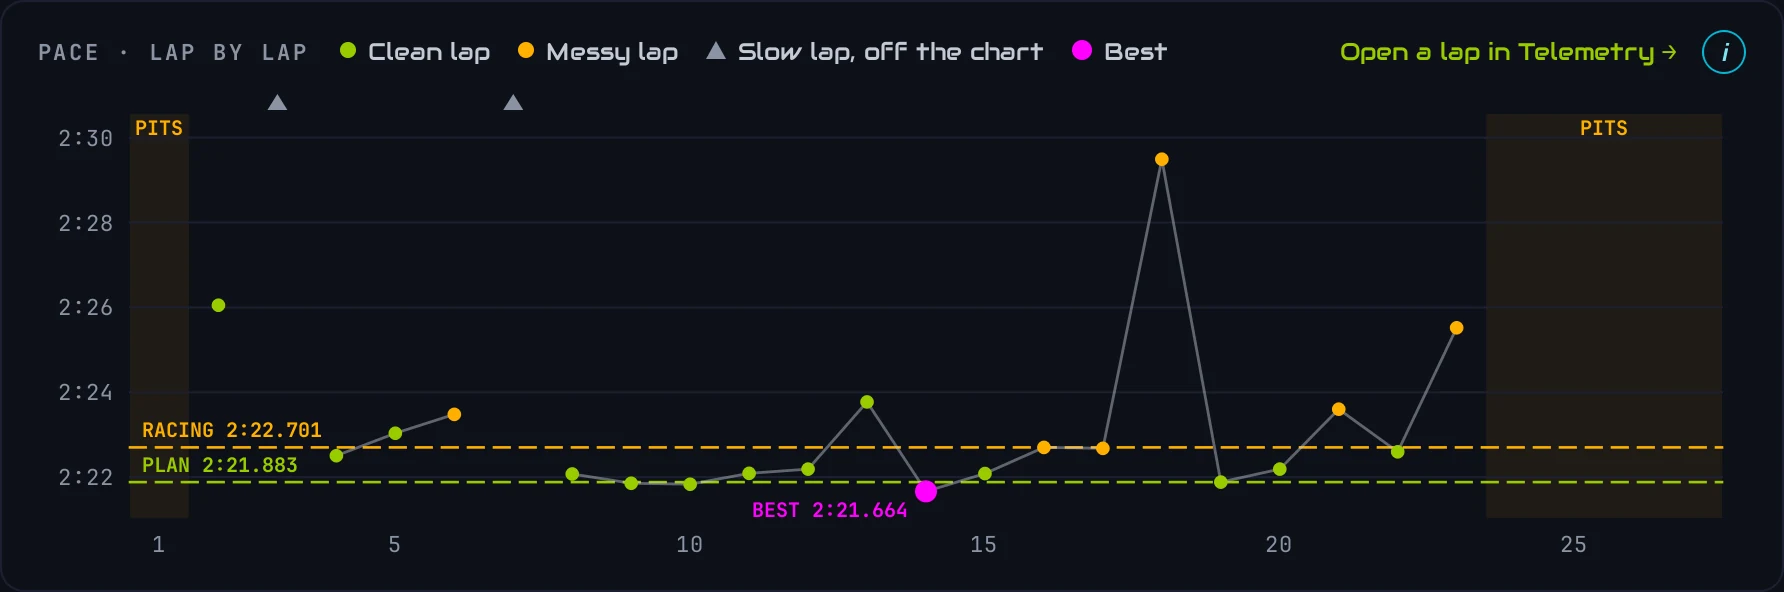
Every lap you drove, in order. Green dots are clean laps; amber dots had traffic or a mistake in them. A lap too slow to fit on the chart is a grey triangle along the top, so one slow lap can't squash the rest. Pink is your best lap. The green dashed line is the lap time the race plan uses, and the amber one is your racing pace with the messy laps counted in. Hover a dot for its time, and Open a lap in Telemetry takes you to that lap's traces.
Plan on thisRace reality
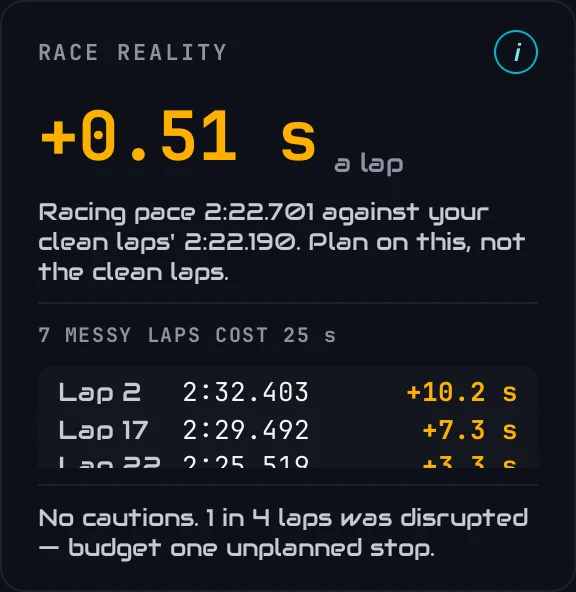
Your clean laps are the best case. Your racing pace is the middle of all your green-flag laps, traffic and mistakes included, which is what a race actually looks like. The big number is the difference a lap, and it's the one to plan around. Below it: the laps that cost the most, and what to budget for, a little extra fuel or an unplanned stop if enough of your laps were disrupted.
TyresTyres · end of stint
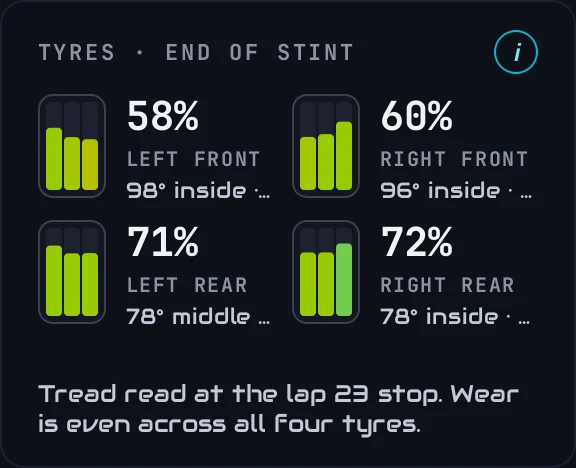
Each tyre when you pitted at the end of your longest stint, laid out like the car. The three bars are the outside, middle and inside of the tread: their height is the tread left, and their colour is how hot that part ran in the corners (green is the working range, blue cold, red too hot). The big number is the most-worn part of the tyre; under it, how hot that part ran and the tyre's average pressure. The line under the tyres says which stop the tread was read at and names the tyre that limits a stint. It's the same card as on the Overview.
What to look for: one part of the tread wearing much faster than the others. A hot, worn middle points to too much pressure. An inside edge that's hot and worn can mean too much camber, but only on a tyre that was actually carrying the car: on an oval, or a strongly one-sided circuit, the tyres on the inside of the corners barely load, so they read hot on the inside whatever the camber. The app judges camber only on loaded running for that reason.
TyresTyres · lap by lap
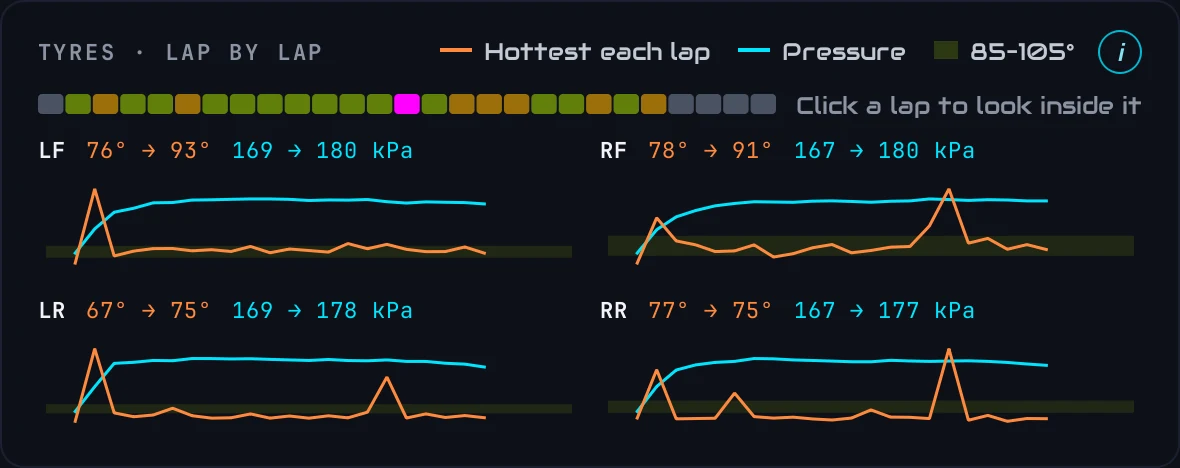
For each tyre, the hottest the middle of the tread got on each lap (when it's working hardest, in the corners) and its pressure. Laps in the pits are left out. The green band is the working range for a racing slick: lap after lap, a line under the band means that tyre isn't getting up to temperature, and above it, it's running too hot.
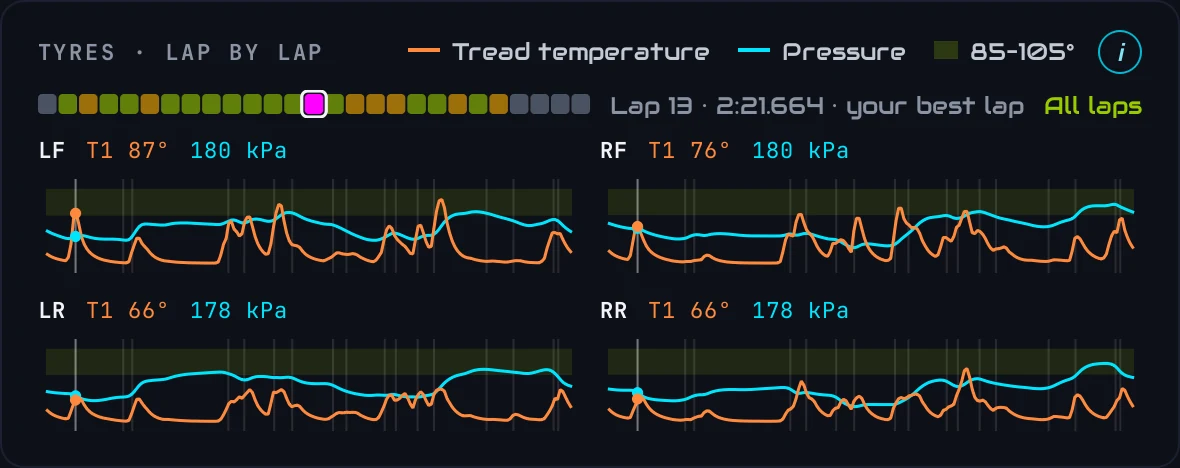
Pick a lap (on the strip under the title, or click it on any of the four charts) to look inside it: the same two readings through that lap, start to finish, with a faint line at each corner. Hover to read them anywhere ("T7 111°"), and All laps takes you back. Inside one lap the tread cools on the straights, so the line dips under the band between corners: what matters is how hot it gets in them.
StopsPit stops
Every pit stop: the lap you came in, the time from pit entry to pit exit, the time the car was stationary, the fuel added, the tyres changed and whether repairs were done. The race plan uses the average time a stop cost you here. A stationary time much longer than the fuel needed points to time lost to tyres or repairs.